Specialty Crops Need Economic Aid

photo credit: AFBF
Daniel Munch
Economist
Key Takeaways
- Safety-net gaps remain for specialty crops: Specialty crops generate more than $75 billion in annual farm-gate value, over one-third of U.S. crop sales, yet these farmers have access to fewer risk-management and commodity safety-net tools than other sectors.
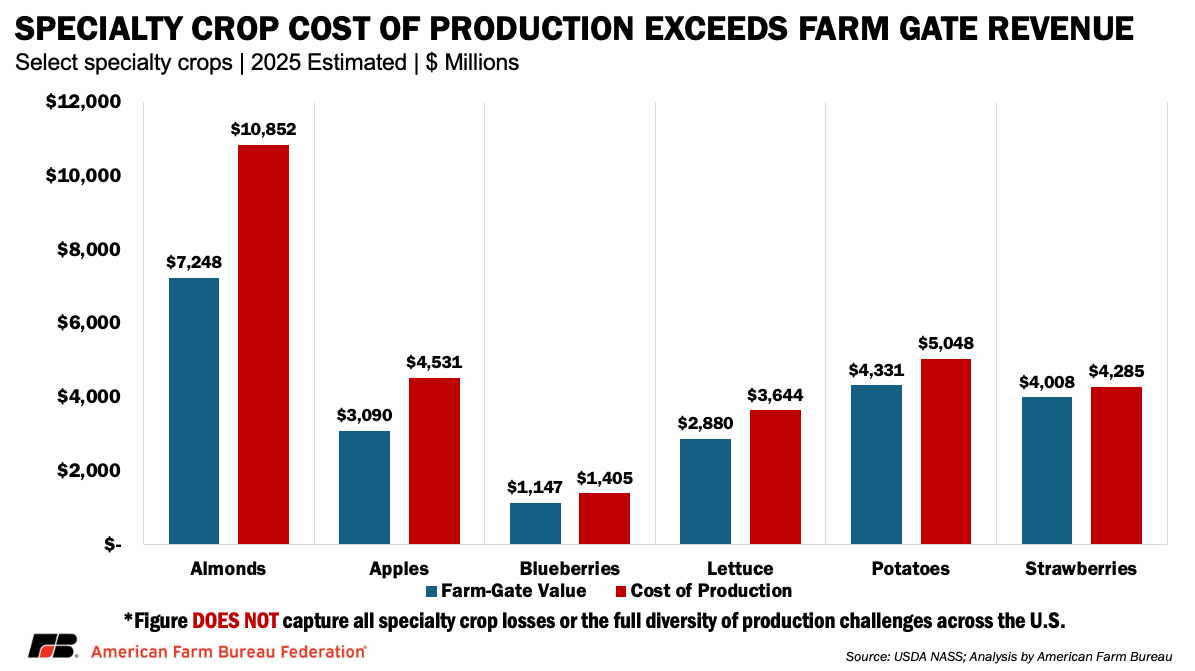
- Costs have risen faster than prices across diverse crops: Case studies covering almonds, apples, blueberries, lettuce, potatoes and strawberries show labor, input, compliance and capital costs climbing sharply, while farm-gate prices are not keeping pace with the costs.
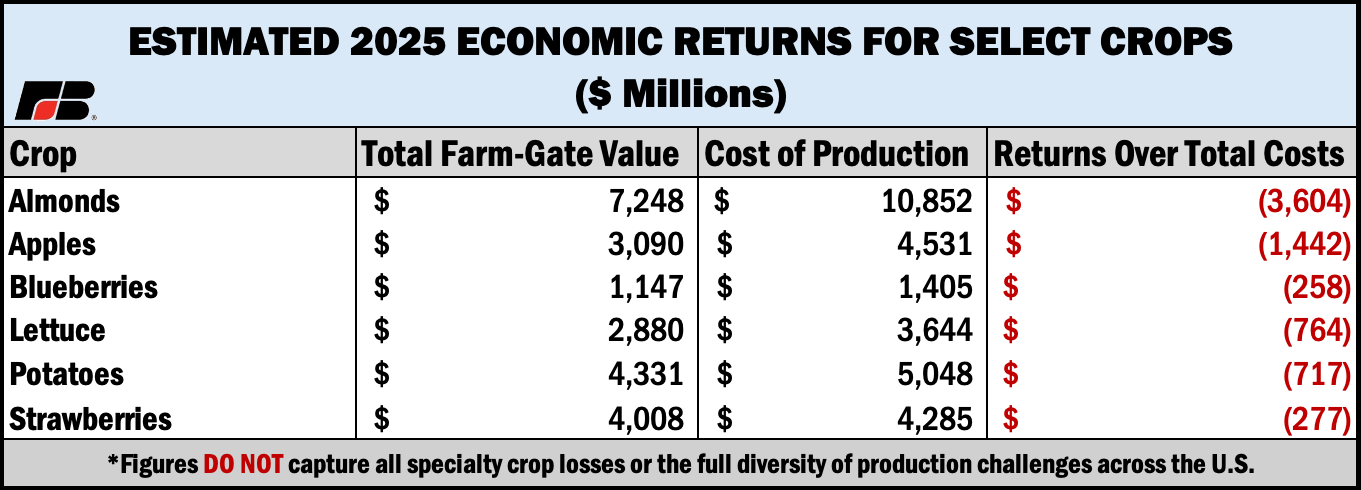
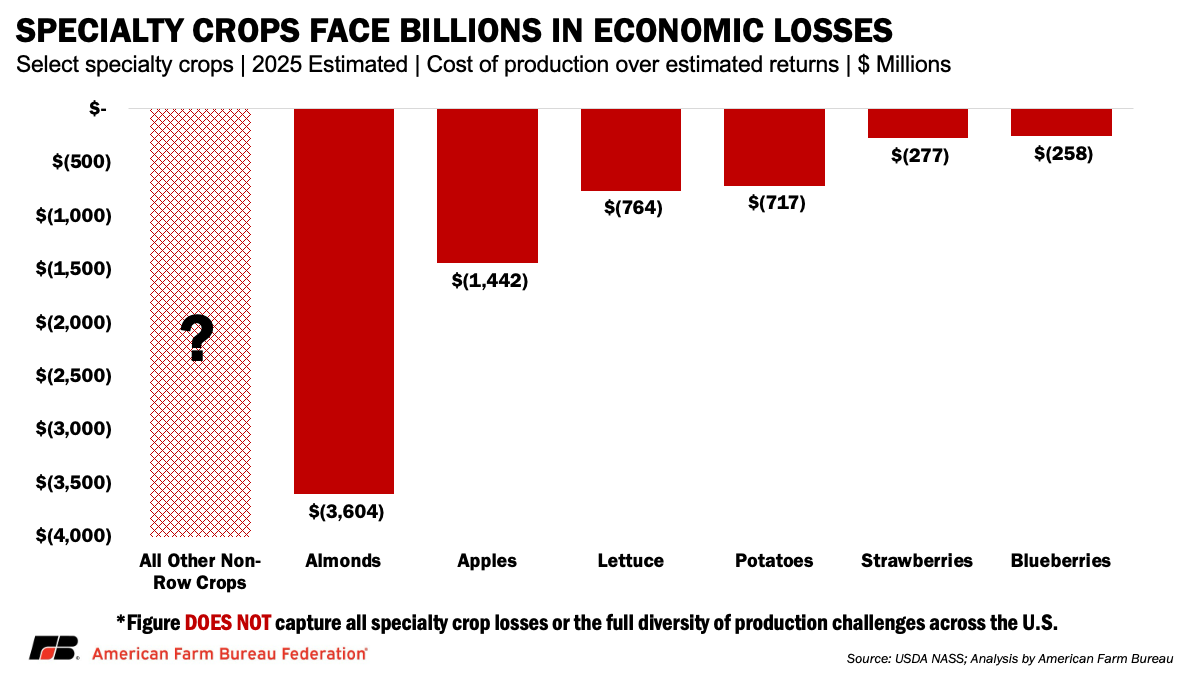
- Losses are widespread: These six crops alone account for roughly one-quarter of total specialty crop receipts and collectively reflect billions of dollars in 2025 economic losses, indicating that sector-wide hardship extends well beyond the crops analyzed.
- Trade, labor and weather pressures compound financial stress: Ongoing trade uncertainty, rising labor costs, disease and pest pressures and increasing weather volatility have tightened margins across regions and marketing channels, leaving many growers unable to recover full economic costs.
- Recent aid leaves gaps: Specialty crop farmers do not qualify for the $11 billion Farmer Bridge Assistance Program, and while USDA has announced $1 billion in additional support for other crops, the funding falls far short of documented economic need.
For specialty crop farmers, 2025 has offered little relief from mounting financial pressures. Markets that once delivered stable margins are now marked by volatility, while production expenses continue to rise faster than prices. Trade uncertainty further threatens already-thin farm-gate revenues. Despite generating more than $75 billion in annual farm-gate value – over one-third of all U.S. crop sales – specialty crop producers operate with far fewer risk-management and safety-net tools than other farmers. The result is a widening cost-to-revenue gap that is placing broad swaths of the specialty crop economy under severe financial strain.
Specialty crops encompass more than 350 commodities across 220,000 farms, accounting for roughly one-fifth of U.S. agricultural cash receipts. Yet the diversity that makes the sector so economically important also heightens its vulnerability. Each crop carries unique production systems, marketing channels, labor needs and biological risks. These differences have made it historically challenging to design an effective safety net and also complicates access to reliable economic data. Unlike other commodities such as row crops, milk, cattle or hogs, many specialty crop producers lack consistent, up-to-date, publicly reported cost-of-production and farm-gate price data. For many crops, USDA does not publish average prices until well after the year ends, if at all, and even then, prices often represent only a subset of the market, such as fresh or processed.
This lack of consistent data should not be mistaken for a lack of hardship. One part of U.S. agriculture benefits from publicly supported, frequently updated market information; the other does not. That gap makes it significantly harder to quickly and credibly quantify the economic losses specialty crop farmers are absorbing.
To illustrate the scale of need, this analysis examines six representative crops: almonds, apples, blueberries, lettuce, potatoes and strawberries. These crops were selected because they are among the few specialty commodities with enough available data to conduct analysis, while collectively reflecting the diversity of production systems, regions and marketing channels that define the broader sector. Together, they account for roughly one-quarter of total specialty crop receipts, meaning the true sector-wide losses are significantly larger than what these case studies alone capture. Yet the pressures outlined here (high labor and input costs, tightening margins, weather and disease challenges and ongoing trade instability) are shared across nearly the entire specialty crop sector.
These growers will not benefit from the $11 billion in the Farmer Bridge Assistance Program, leaving substantial unmet need among the commodities examined here and beyond. USDA also announced a welcomed $1 billion specialty crop growers expect to be eligible for, but details and timing remain unknown, and the scale of funding falls well short of the sector’s outstanding economic need.
Any cost-of-production studies used in this report that predate 2020 have been indexed to 2025 dollars. Importantly, this adjustment remains conservative, as many input categories have increased at rates exceeding general inflation.
Almonds
Almonds are the nation’s highest-value tree nut crop, generating $5.7 billion in revenue, but the industry has been under financial stress. From 2019 to 2023, the average almond price declined to $1.81 per pound, down from $3.05 per pound during 2014–2018. Meanwhile, cost and return studies from the University of California show operating expenses increasing roughly 40% between 2019 and 2024, while gross returns fell 36%, pushing net returns into negative territory. Based on these studies, the breakeven price for almonds is between $3.80 and $4.31 per pound.
Several factors have contributed to this squeeze. The industry’s large inventory buildup was driven not only by a series of record harvests, including the 3.12-billion-pound crop in 2020, but also by severe shipping constraints during the pandemic that made it difficult for growers and handlers to access overseas markets they depended on. As backlogs mounted at West Coast ports, product that normally moved efficiently into export channels accumulated instead, slowing price recovery. At the same time, international buyers have become more cautious, responding to higher interest rates, currency volatility, and shifting consumer spending patterns. China has long been a major export destination for U.S. almonds, but ongoing trade tensions continue to limit access in 2025. Tariffs and policy uncertainty contributed to a 38% decline in China’s imports of U.S. tree nuts in the first half of the year, reducing a key outlet for growers trying to clear excess supply. At the same time, producers face structurally higher costs — water scarcity, rising labor expenses, elevated fertilizer and fuel prices, and the ongoing need to remove and replant aging orchards. Even as market prices have begun to rebound, these pressures mean many growers are only just covering operating costs and remain far short of recovering full economic costs, leaving overall financial conditions in the sector strained.
Estimated 2025 Almond Economic Losses
The University of California’s 2024 cost-of-production studies across the Sacramento Valley (2024) and the northern and southern San Joaquin Valley show an average total cost of $8,004 per acre, inclusive of operating expenses, cash overhead, and the non-cash costs of land, equipment and orchard investment. While costs vary depending on farm size, location, water availability and management practices, this figure provides a reasonable benchmark for understanding sector-wide economic pressure. With 1.356 million bearing acres in 2024 and an average yield of 1,980 pounds per acre, total annual production costs reached an estimated $10.85 billion. Farmers received an average preliminary price of $2.14 per pound in 2024. Because USDA’s price received estimates are updated as additional marketing-year transactions are reported, this figure may shift, but it remains the best available indicator of grower returns during the year. At a representative yield of 1,980 pounds per acre, almond production generated roughly $5.7 billion in farm-level revenue — leaving the sector with a net loss of about $5.1 billion.
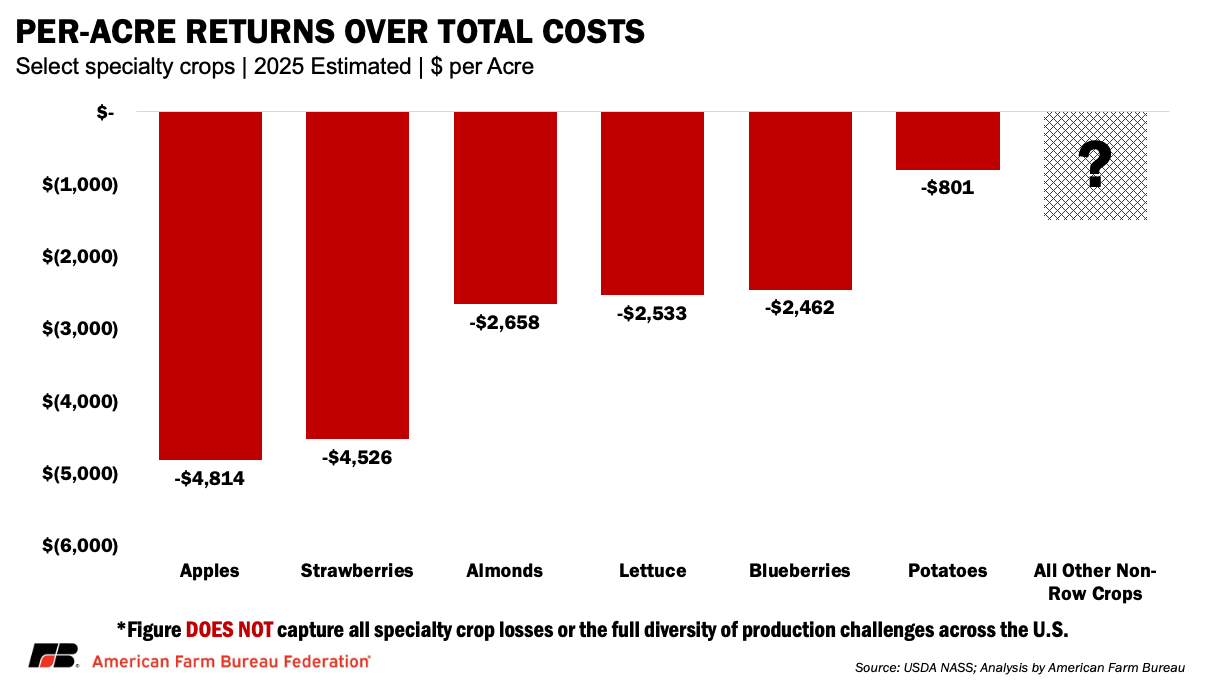
While official 2025 prices are not yet available, market commentary indicates some price recovery. Under the same acreage and yield assumptions as 2024, a market price of $2.70 per pound (as reported by AgNet West) would generate about $7.2 billion in revenue — still leaving an estimated $3.6 billion sector-wide loss ($2,658 per acre), underscoring the continued financial strain facing almond producers even amid improving market conditions. This remains an optimistic scenario; actual 2025 prices could fall below this level depending on export demand and global economic conditions.
Apples
Apples are one of the nation’s highest-value fruit crops, generating roughly $2.9 billion in cash receipts in 2024, but growers continue to face margin pressures. After several years of large national crops and heavy inventories (particularly in Washington, which supplies over two-thirds of U.S. apples), prices have struggled to keep pace with rising production costs. USDA reports modest price improvement for some premium varieties in late 2024 and early 2025 but returns for major staples such as Gala and Fuji remain well below peaks seen earlier in the decade. At the same time, university cost studies show substantial increases in labor, input, storage and capital expenses. Full-production estimates from Washington State University place high-density orchard costs between $46,000 and $55,000 per acre, while even Eastern production regions report steady year-over-year increases in both operating and overhead costs. Reviewed cost-of-production studies indicate breakeven prices for apples range from roughly 11 cents per pound for processing apples to 74 cents per pound for fresh-market apples, with nearly 70% of U.S. apples sold into the fresh market. By comparison, USDA reports that the average 2024 farm-gate price across all categories was 28 cents per pound, including 9 cents for processing apples and 34 cents for fresh apples, well below estimated breakeven levels for much of the industry.
Several forces are driving this squeeze. Successive large crops in Washington and Michigan have built inventories that weigh on early-season pricing and slow movement through domestic and export channels. Export markets, critical for clearing fresh apples, have been uneven: Mexico remains strong but price-sensitive; India is still recovering from years of retaliatory tariffs; and competition from Southern Hemisphere suppliers continues to pressure U.S. shipments. Currency strength and global economic uncertainty have also made foreign buyers more cautious. On the cost side, producers face higher labor expenses under the rapidly rising Adverse Effect Wage Rate, elevated storage and packing charges, and significant capital requirements for replanting older blocks with new high-density systems and club varieties. Even with modest price improvement for some varieties heading into 2025, rising labor, storage and capital expenses mean that many growers, particularly those producing high-volume conventional varieties, are covering short-run operating costs but falling short of fully recovering long-run economic costs. As a result, overall financial conditions in parts of the industry remain tight.
Estimated 2025 Apple Economic Losses
Cost-of-production studies from Washington State University (2024),Pennsylvania State University (2023), and Cornell University (NY, 2018-indexed) indicate an average full economic cost of roughly $835 per ton, inclusive of operating expenses, cash overhead, and the annualized non-cash costs of land, equipment and orchard establishment. Combined, the states these three universities represent contribute about 84% of total U.S. apple production by value. Production costs vary widely depending on production system, with high-density vertical spindle and angled-V orchards reaching well over $2,000 per ton, while older, traditional systems geared toward processing apples can fall closer to $220 per ton. With 299,500 bearing acres in 2024 and an average yield of 18.12 tons per acre (USDA- National Agricultural Statistic Service), total annual production costs reached an estimated $4.5 billion. Because comprehensive farmer-price data for 2025 are not yet available, the recent three-year average is used as a proxy. Over that period, grower prices declined from 32 cents per pound in 2022 to 28 cents per pound in 2024. Applying a price of 28 cents per pound to the 2024 yield results in approximately $3.08 billion in farm-level revenue — leaving the sector with an estimated net shortfall of about $1.4 billion or $4,814 per acre.
Blueberries
Blueberries are one of the nation’s highest-value specialty fruit crops, generating roughly $1.2 billion in cash receipts in 2024, but growers continue to face mounting cost-price pressures. While domestic consumption has expanded, grower prices have softened relative to earlier peaks, with tame (highbush) blueberries averaging about $1.45 per pound in 2024 ($2.22 for fresh and 52 cents for processing at the farm level), while wild blueberries, sold almost entirely into individually quick frozen (IQF) channels, returned roughly 50–60 cents per pound to growers for unprocessed fruit ($2.54 for fresh and 51 cents for processing). Pacific Northwest cost-of-production studies show expenses far outpacing returns. Oregon State University and Washington State University budgets for mature tame blueberries routinely place full economic costs between $14,000 and $20,000 per acre, depending on labor programs, pruning intensity and fresh-pack requirements. Reviewed cost-of-production studies indicate break-even prices of $1.78 per pound for tame blueberries, well above 2024 market averages of $1.45.
Several forces are driving this squeeze. Blueberries are uniquely labor- and quality-dependent, and hand-harvested fresh fruit growers are at the mercy of rising labor costs, escalating sorting and packing costs, and increasingly complex food-safety and traceability requirements. Even machine-harvest systems (which reduce harvest labor) carry significant expenses: specialized equipment, more intensive pruning for machine suitability, higher cull rates and greater reliance on fresh-pack lines to remove debris and maintain retail quality, all of which keep total costs elevated. Pest pressure, particularly from spotted wing drosophila, has increased spray and monitoring requirements and frequently forces growers to divert fruit from fresh markets into much lower value processing channels, eroding anticipated premiums. Establishment costs have also climbed as growers replace aging cultivars with higher-input, fresh-oriented genetics that demand more intensive fertigation, pruning and canopy management.
Competitive pressure from imports has further complicated the market. Supplies from Peru, Mexico and Chile continue to expand the U.S. retail window but also weigh on domestic prices, especially in the early and late season. With higher labor, input and packing costs outpacing price gains, and fresh-market premiums increasingly difficult to secure, many U.S. blueberry growers are covering short-run operating costs but falling short of recovering full long-run economic costs. As a result, financial conditions across much of the industry remain negative.
Estimated 2025 Blueberry Economic Losses
Because tame blueberries account for roughly 82% of U.S. blueberry acreage harvested and 96% of farm-level value, and because they have far more robust cost data, this analysis focuses exclusively on losses in the tame segment. Cost-of-production studies from Washington State University (2022), Oregon State University (2025), the University of Georgia (2025) and Michigan State University (2024) indicate an average full economic cost of approximately $13,406 per ton — a figure that incorporates operating expenses, cash overhead and the annualized non-cash costs of land, equipment and establishment. Combined, the states these universities represent contribute nearly 60% of U.S. blueberry production by value.
Using USDA’s estimate of 104,800 bearing acres of tame blueberries in 2024 and an implied average yield of 7,548 pounds per acre, total production reached roughly 791 million pounds, placing annual economic production costs at about $1.4 billion. Because comprehensive 2025 farmer-price data are not yet available, the 2024 price of $1.45 per pound is used as a proxy for grower returns. Applying this price to 2024 output results in approximately $1.14 billion in farm-level revenue, leaving the tame blueberry sector with an estimated net economic shortfall of about $257 million or $2,642 per acre.
While this analysis centers on tame blueberries due to more robust cost data, wild blueberries face a distinct but equally severe economic reality. In 2025, extreme weather and sharply higher production costs drove estimated losses exceeding $28 million in Maine’s wild blueberry industry, even as some acreage went unharvested due to weak market conditions and elevated break-even thresholds.
Lettuce
Lettuce is one of the nation’s highest-value vegetable crops, generating roughly $4.6 billion in cash receipts in 2024, yet growers continue to face intense cost–price pressures. After several years of weather-driven volatility, 2025 prices have fallen sharply: romaine lettuce is averaging just $14.55 per carton, nearly half of 2024 levels. At the same time, per-acre production costs in California’s desert and coastal regions routinely reach $16,000–$20,000, equivalent to $17–$20 per carton at typical yields of 850–1,000 cartons per acre — leaving many growers unable to cover full economic costs even in years of good volume.
Rising compliance expenses have further reshaped the cost structure. Cal Poly’s long-term case study shows food safety, labor, and water quality compliance costs have risen fifteen-fold since 2006, climbing from $109 per acre to more than $1,600 per acre and now making up over 12% of total production costs, compared to barely 1% two decades ago. Similar pressures extend across other major production regions like Arizona, where growers face elevated labor costs, higher input and packaging prices, and tightening water availability.
Trade dynamics have also added pressure. While the U.S. exports relatively modest volumes of lettuce, imports from Mexico continue to expand, particularly during seasonal production gaps. These shipments, often produced under lower labor and regulatory costs, put downward pressure on domestic prices during key marketing windows. At the same time, some foreign buyers have diversified toward Canadian greenhouse and Mexican field production, reducing demand for U.S. product. Combined with elevated transportation costs and tighter retailer purchasing requirements and strategies, these trade and market shifts have made it more difficult for domestic growers to command premiums or pass through rising production costs.
As a result, many U.S. lettuce producers are covering short-run operating expenses but falling short of recovering long-run economic costs, leaving financial conditions across much of the sector strained heading into 2025.
Estimated 2025 Lettuce Economic Losses
U.S. lettuce production occurs almost entirely in California and Arizona, which together account for roughly 100% of national output. Cost-of-production studies from the University of California (2023) show that iceberg and romaine lettuce carry an average full economic cost of about $19.50 per carton (≈50 pounds), a figure that reflects operating expenses, cash overhead, and the annualized non-cash costs of land, equipment and field establishment. Using USDA’s estimate of 301,400 lettuce acres in 2024 and an average yield of 620 cartons per acre, total production reached roughly 186 million cartons, placing the sector’s annual economic production costs near $3.6 billion.
Because comprehensive farm-price data for 2025 remains limited, the analysis uses an average of USDA’s 2025 monthly reported price ($16.28 per carton) and Terrain’s market summary ($14.55 per carton). Applying this price to 2024 output generates approximately $2.88 billion in farm-level revenue — leaving the lettuce sector with an estimated economic shortfall of about $763 million or $2,533 per acre.
Potatoes
Potatoes are one of the nation’s most economically significant vegetable crops, generating between $3 billion and $5 billion in farm cash receipts annually, but growers entered 2025 facing some of the steepest cost-price imbalances in over a decade. While USDA’s average grower price for 2024–2025 has hovered near $11.75 per cwt, that figure masks a sharply divided market: the majority of the crop (75% or more) moves under processing contracts that hold prices relatively stable, while prices have collapsed to $3–$6 per cwt in a much smaller open-market segment, with distressed lots trading even lower. This bifurcation has left uncontracted growers acutely exposed to oversupply and limited movement in fresh channels, particularly in regions such as the Columbia Basin of Washington, southern Idaho, Wisconsin’s Central Sands, and parts of the Red River Valley, where processors cut contract acreage or where high yields created burdensome local surpluses.
At the same time, production costs have continued to rise. Updated cost-of-production studies from UC Davis, Washington State University, the University of Idaho, and the universities of North Dakota and Minnesota place full economic costs at an average $12.25 per cwt — leaving contracted growers operating slightly below breakeven, while many uncontracted growers face prices that fall far short of covering costs. Several structural factors are contributing to this squeeze. Labor, fertilizer and energy expenses remain elevated following multiple years of input inflation; storage, grading and packing charges have increased alongside energy and capital costs; and disease pressures, including late blight, Potato Virus Y, and storage rot issues, have raised management intensity and shrink losses. Contract reductions in 2024–2025 left some producers without secure outlets, pushing more product into the thin open market and amplifying downward price pressure.
Movement has also slowed in some fresh and processing channels. While demand for frozen products remains strong, processors have been more conservative in contracting volumes, and fresh-market shipments have faced greater competition from Canadian supplies, variable-quality lots and logistical challenges in moving oversize crops. With open-market prices trending well below breakeven for many growers and contract prices barely covering full economic costs in several regions, financial conditions across the potato sector remain strained. Many producers are covering short-run operating expenses but falling short of recovering long-run capital, storage and land costs, leaving the sector vulnerable to continued volatility in 2025.
Estimated 2025 Potato Economic Losses
Exact estimates of the share of potatoes sold under contract versus the open market are not available, but USDA utilization data provide a defensible proxy. In 2024, roughly 75% of U.S. potatoes were used in processing channels, and these markets (frozen, chipstock and dehydrated) almost exclusively rely on pre-season contracts to secure consistent volume and quality. Conversely, most fresh-market movement occurs outside formal contracts, with prices determined by weekly supply-and-demand conditions. Because of this well-documented market structure, the processing share is used here as a proxy for contracted volume, and the fresh-share is used as a proxy for uncontracted supply.
Cost-of-production studies from UC Davis (2023), Washington State University (2019), North Dakota State University (2025), the University of Minnesota (2025)and the University of Idaho (2016-indexed) place the average full economic cost of production near $12.25 per cwt, inclusive of operating expenses, cash overhead, and the annualized non-cash costs of land, equipment and storage infrastructure. Combined, the states these universities represent contribute nearly 65% of U.S. potato production by value.
Using USDA’s estimate of 894,800 acres harvested in 2025 and an average yield of 460 cwt per acre (for a national output of roughly 412 million cwt), total production costs reached approximately $5 billion. For contracted potatoes, USDA’s 2025 year-to-date average price of $11.75 per cwt is applied. For the remaining 25% of supply assumed to be uncontracted, a $6.88 per cwt weighted open-market price is used, based on an 80/20 weighting of average russet prices (which make up the majority of fresh-market volume) and average red and yellow potato prices. Applying these prices to 2025 production yields approximately $4.3 billion in farm-level revenue, leaving the sector with an estimated net economic shortfall of about $717 million or $801 per acre.
Strawberries
Strawberries are one of the nation’s most valuable fruit crops, generating roughly $3.5–$4.0 billion in cash receipts annually, but growers continue to face severe margin pressure as costs rise faster than prices. National grower prices averaged about $1.24 per pound across fresh and processing fruit in 2024 — levels that have not kept pace with escalating production expenses. Cost-of-production studies from the University of California show conventional fresh-market strawberries exceeding $110,000 per acre, with full economic costs translating to $1.50–$1.60 per pound at typical yields, meaning many growers are operating at or below breakeven even in strong marketing years.
Several forces are contributing to this squeeze including structurally higher labor costs, rapidly rising labor rates, and increasing compliance requirements related to pesticides, water quality, food safety and plasticulture disposal. These pressures come on top of elevated fertilizer, fuel and plant material costs. Weather volatility (late rains, heat spikes and disease pressure) has also complicated production, increasing cull rates and reducing marketable yields during critical harvest windows. Marketing conditions have tightened as well. While consumer demand for fresh strawberries remains strong, processing prices remain very low (often 40–50 cents per pound), and excess fruit diverted from fresh into processing channels can significantly reduce grower returns. Competition from Mexican winter and early-spring imports has further pressured early-season pricing, while domestic retail buyers have held firm on contract pricing despite growers’ rising input costs. Even with solid yields in 2024 and early 2025, the combination of higher labor, compliance, input and packaging costs means many strawberry producers are covering day-to-day operating costs but not fully recovering long-run economic costs, leaving overall financial conditions across major producing regions strained.
Estimated 2025 Strawberry Economic Losses
U.S. strawberry production occurs almost entirely in California and Florida. Cost-of-production studies from the University of California (2024) and University of Florida (2020) show that strawberry production carries an average full economic cost of about $133 per cwt, a figure that reflects operating expenses, cash overhead, and the annualized non-cash costs of land, equipment and field establishment. Using USDA’s estimate of 61,200 harvested strawberry acres in 2024 and an average yield of 528 cwt per acre, total production reached roughly 32 million cwt, placing the sector’s annual economic production costs near $4.3 billion.
Because comprehensive farm-price data for 2025 remain limited beyond only fresh market prices, which are skewed higher, the analysis uses 2024’s average as a proxy ($124/cwt). Applying this price to 2024 output generates approximately $4 billion in farm-level revenue — leaving the strawberry sector with an estimated economic shortfall of about $276 million or $4,525 per acre.
Conclusion
The evidence across these six crops points to the same conclusion: specialty crop growers are facing deep and persistent economic losses that existing federal support does not address. No specialty crops will receive assistance from the $11 billion Farmer Bridge Assistance Program, despite the sector representing a third of all crop receipts and billions in documented 2025 losses. USDA’s announcement of an additional $1 billion for “other crops” offers limited relief, and without clear eligibility criteria, its reach and impact remain uncertain. Even if fully directed toward specialty crops, the funding would still represent only a fraction of the sector’s outstanding need.
The pressures documented here, rising input expenses, tightening margins, weather and disease disruptions, labor expenses and constraints, and global trade instability, are not isolated problems but structural realities affecting a wide range of crops, including specialty. Without a more responsive and equitable risk-management framework, specialty crop producers will continue absorbing losses that threaten long-term viability, investment and acreage.
Strengthening support for this sector is not merely an economic necessity; it is essential to maintaining a resilient and diverse U.S. food system.
Top Issues
VIEW ALL