Reviewing County-Level Corn and Soybean Yields in 2018
TOPICS
Soybeans
photo credit: AFBF Photo, Morgan Walker
John Newton, Ph.D.
Vice President of Public Policy and Economic Analysis
On March 21, USDA’s National Agricultural Statistics Service published the County Yield Estimates, which include county average crop yields per harvested acre for corn and soybeans.
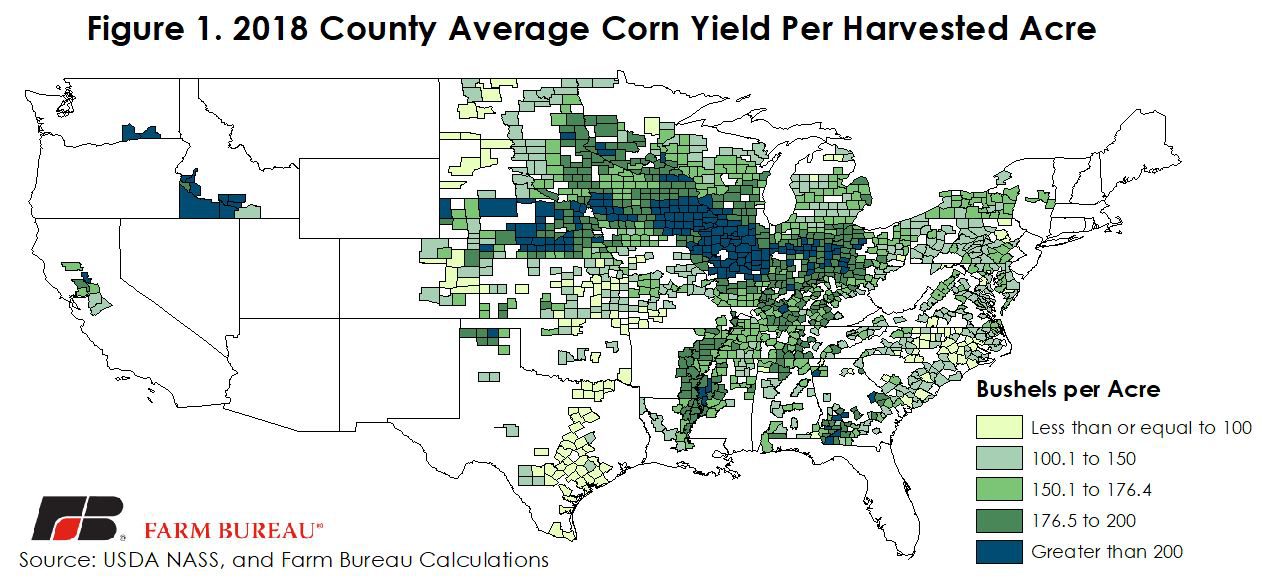
Corn Yields
During 2018, the U.S. average corn yield was 176.4 bushels per acre, down slightly from the prior year. At the county-level, corn yields ranged from less than 100 bushels per acre in portions of the Southeast and the western Corn Belt to greater than 200 bushels per acre across many portions of the Corn Belt. Corn yields per harvested acre were the lowest in Wake County, North Carolina, and Denton County, Texas, at 42.7 bushels per acre. They were the highest in Benton County, Washington, at 270 bushels per acre. Figure 1 highlights the county average corn yield per harvest acre.
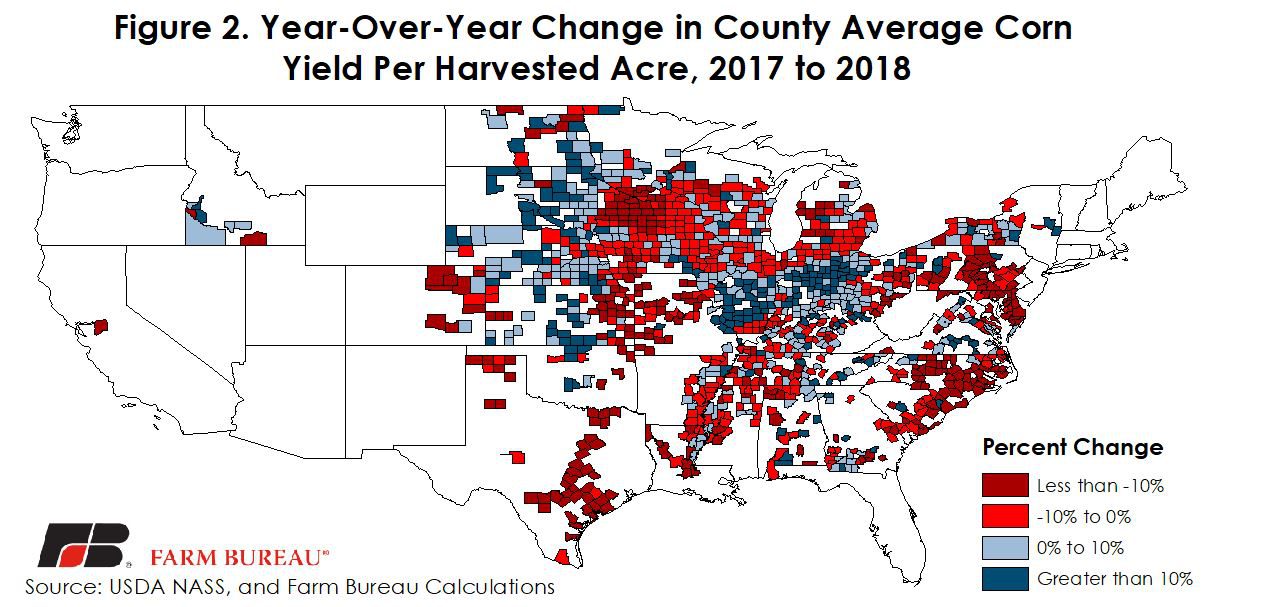
More than half of the corn-producing counties in the U.S. had lower corn yields in 2018 relative to 2017. In total, 651 counties experienced poorer crop yields in 2018 relative to the prior year, with yield declines ranging from as little as 1 percent to greater than 50 percent. Yield declines were the sharpest in portions of the Southeast following two Category 4 hurricanes and in the western Corn Belt following excessive precipitation during harvest season.
While many counties experienced lower corn yields in 2018, across the eastern Corn Belt in Indiana, Illinois and western Ohio, as well as in South Dakota, crop yields were higher compared to prior-year levels. Many counties in these states saw yield increases of more than 10 percent. Figure 2 highlights the year-over-year percentage change in county average corn yields from 2017 to 2018.
Soybean Yields
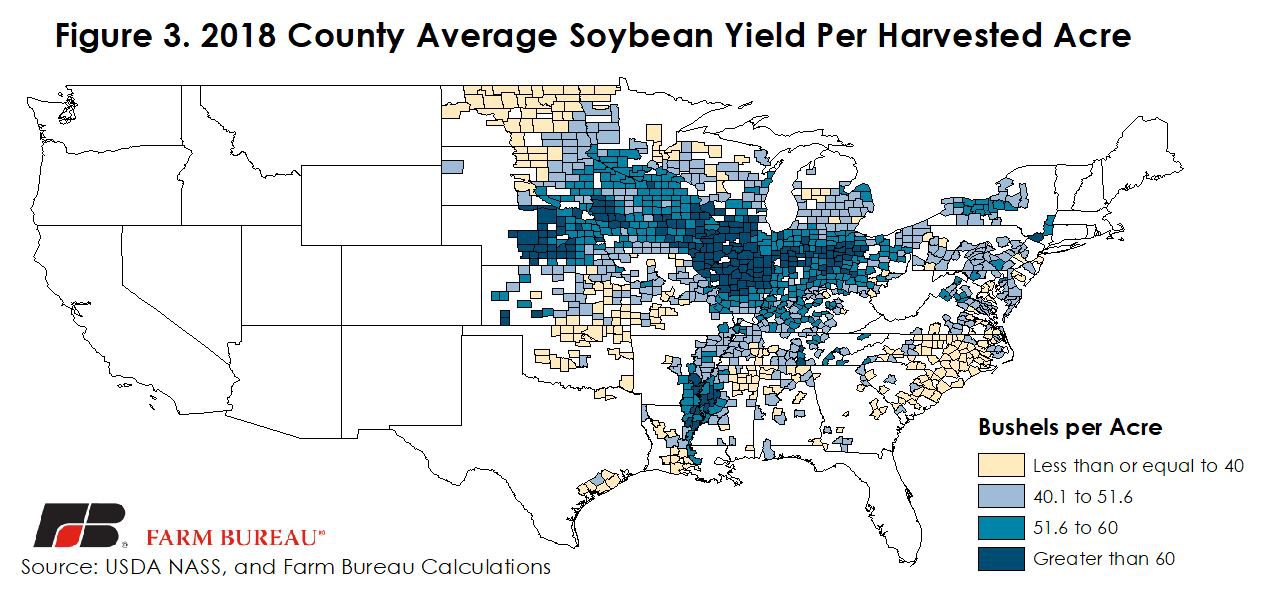
During 2018, the U.S. average soybean yield was 51.6 bushels per acre – the second highest of all time – and up nearly 5 percent from the prior year. At the county-level, soybean yields ranged from less than 40 bushels per acre in portions of the Southeast and Upper Midwest to greater than 60 bushels per acre from Nebraska, through the Corn Belt and into Western Ohio. Soybean yields per harvested acre were the lowest in Onslow County, North Carolina, at 18.4 bushels per acre and were the highest in Sangamon County, Illinois, at 82.3 bushels per acre. Figure 3 highlights the county average soybean yield per harvested acre.
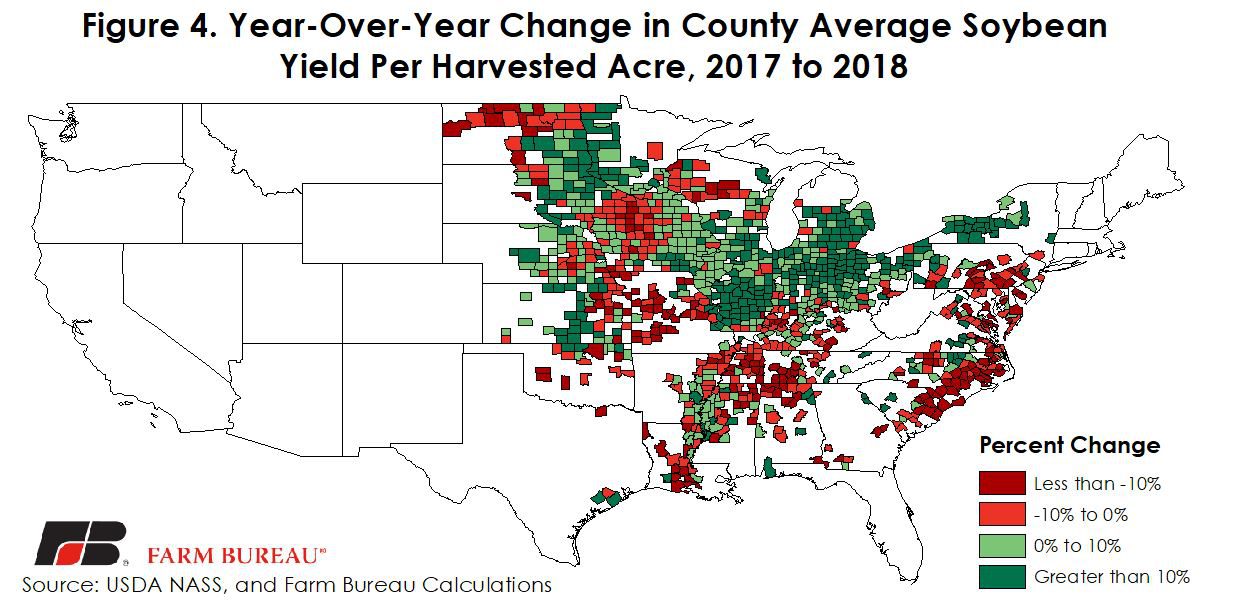
While many counties in the U.S. had lower corn yields in 2018 compared to 2017, in nearly 60 percent of soybean-producing counties soybean yields were higher in 2018. In fact, in more than a quarter of all soybean-producing counties, the yields were more than 10 percent higher than those experienced in 2017. These areas extend from western New York to portions of Kansas and include most of the Corn Belt and southern Michigan.
In areas that experienced heavy and prolonged precipitation, such as the Southeast, portions of Iowa and the Upper Midwest, soybean yields per harvested acre were lower as these heavy rainfalls damaged soybeans during the harvest season. Figure 4 highlights the year-over-year percentage change in county average soybean yields from 2017 to 2018.
Corn and Soybean Yields Per Planted Acre
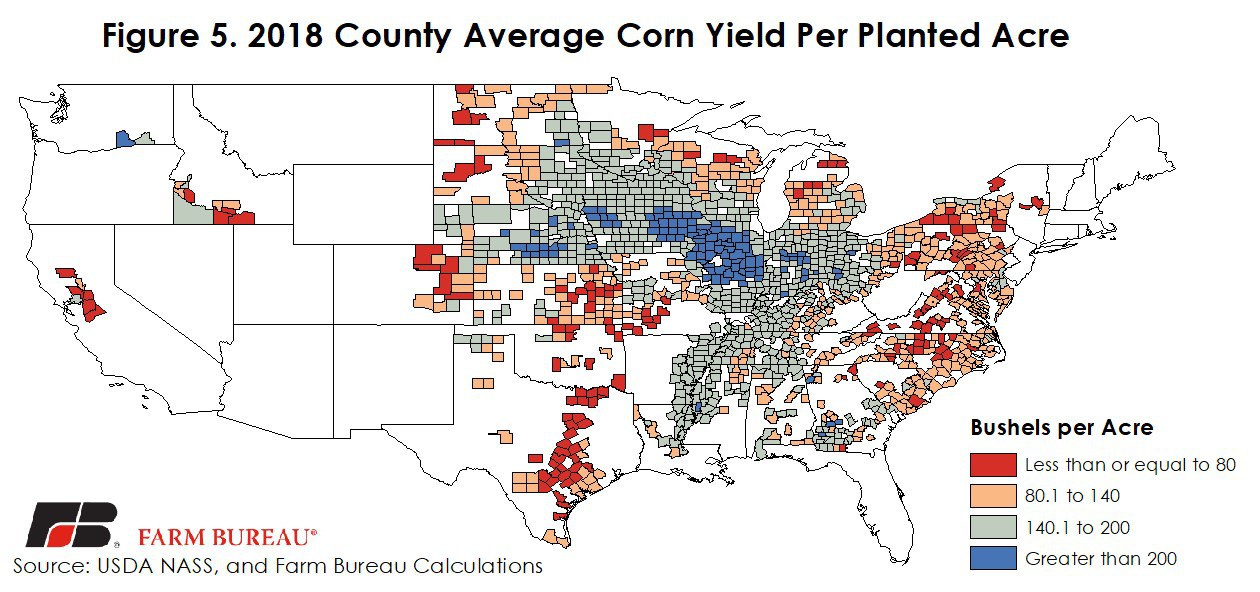
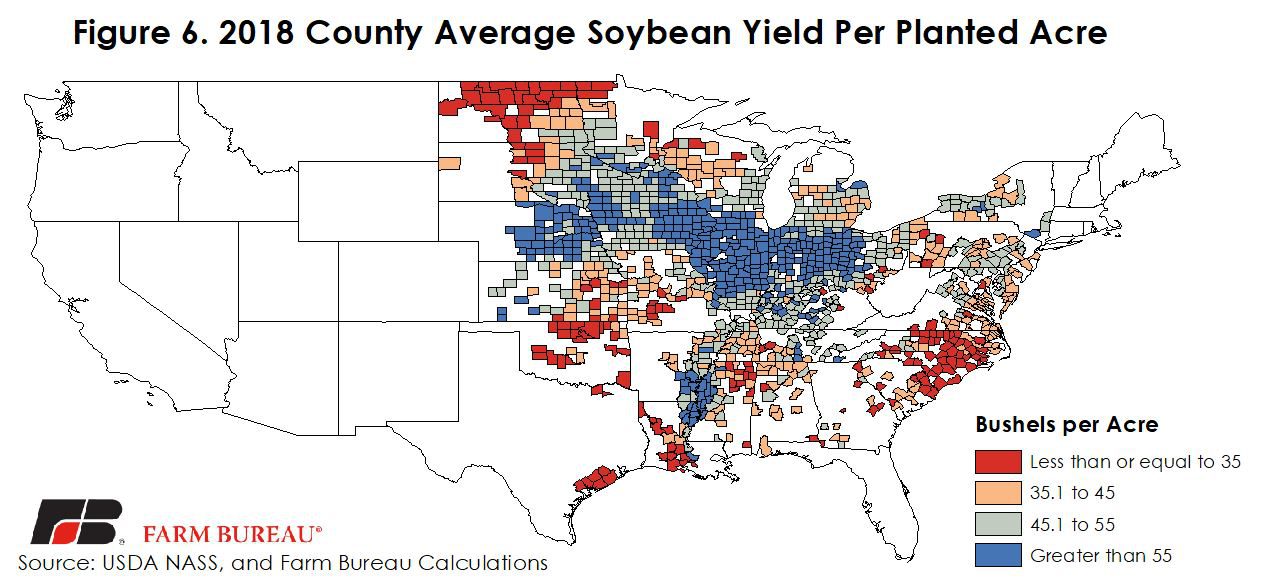
During the prolonged and excessive rainfall that fell on a good portion of the U.S. in 2018, the Southeast, portions of Iowa and the Upper Midwest had more than 60 inches of rainfall, resulting in increased abandonment rates and many unharvested acres of corn and soybeans. The impact of adverse weather is partially shown in the yield per harvested acre in that those crops that were harvested likely still experienced weather damage. However, to more fully capture the impact of adverse weather during the growing and harvest seasons, the yield per planted acre was calculated. (Note: this will also include corn harvested for silage as well as any unharvested acres.)
Yield per planted acre of corn ranged from a low of 3.7 bushels in Stanislaus County, California, to a high of 250 bushels per acre in Benton County, Washington. Yield per planted acre of soybeans ranged from a low of 10.6 bushels in Vermilion Parish, Louisiana, to a high of 82 bushels per acre in Sangamon County, Illinois. Figure 5 and 6 highlight the yield per planted acre for corn and soybeans.
Summary
Carried by very strong yield improvements in portions of Illinois, Indiana, eastern Iowa, western Ohio and other areas, U.S. average corn and soybean yields in 2018 were above trend projections and at or near record highs. However, prolonged and excessive rainfall during the harvest season resulted in lower corn and soybean yields in many counties. In portions of western Iowa, counties along the southern Mississippi River and other parts of the Southeast, crop yields fell by more than 10 percent.
Farmers who experienced a poorer yield or a crop loss in 2018 could potentially receive benefits from crop insurance’s yield or revenue protection policies. The lower crop yields will also factor into Agriculture Risk Coverage program payments as the actual revenue in 2018 could be lower than the benchmark guarantee. Agriculture Risk Coverage is based on the crop yield per planted acre and will help to cover revenue declines experienced due to adverse weather and unharvested acreage.
Top Issues
VIEW ALL