Reviewing State-Level 2017 Net Farm Income
TOPICS
Market Intel
photo credit: Alabama Farmers Federation, Used with Permission
John Newton, Ph.D.
Vice President of Public Policy and Economic Analysis
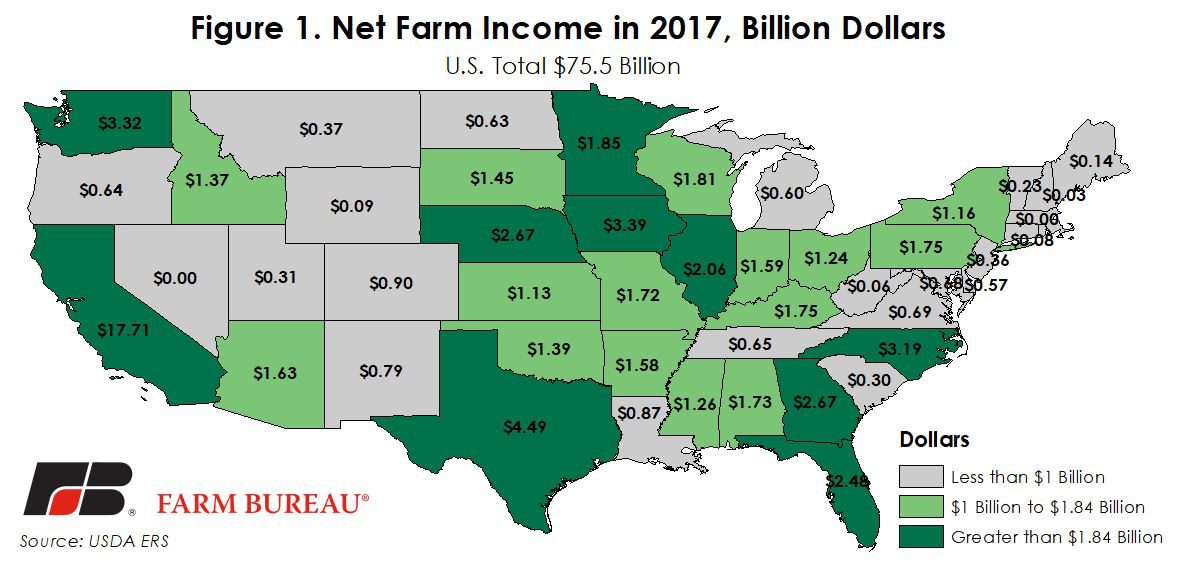
Net farm income is a comprehensive indicator of U.S. farm profitability – for all crops and livestock – and includes cash receipts from farming as well as farm-related income, including government payments and noncash items like changes in inventories, economic depreciation and gross imputed rental income, minus cash expenses. USDA’s August 2018 Farm Income Forecast provided the first state-level estimates of net farm income in 2017.
During 2017, U.S. net farm income was projected at $75.5 billion, up 22 percent from 2016 but well below the record high experienced in 2013. At the state level, net farm income was the highest in California at $17.7 billion, up 23 percent from prior-year levels. Following California was Texas at $4.5 billion, up 6 percent, and Iowa at $3.4 billion, up 4 percent. The top 10 states in terms of net farm income represented $43.8 billion, or 58 percent, of total U.S. farm income. Figure 1 highlights net farm income by state, with the top 10 states in terms of net farm income accented in dark green.
Year-Over-Year Change
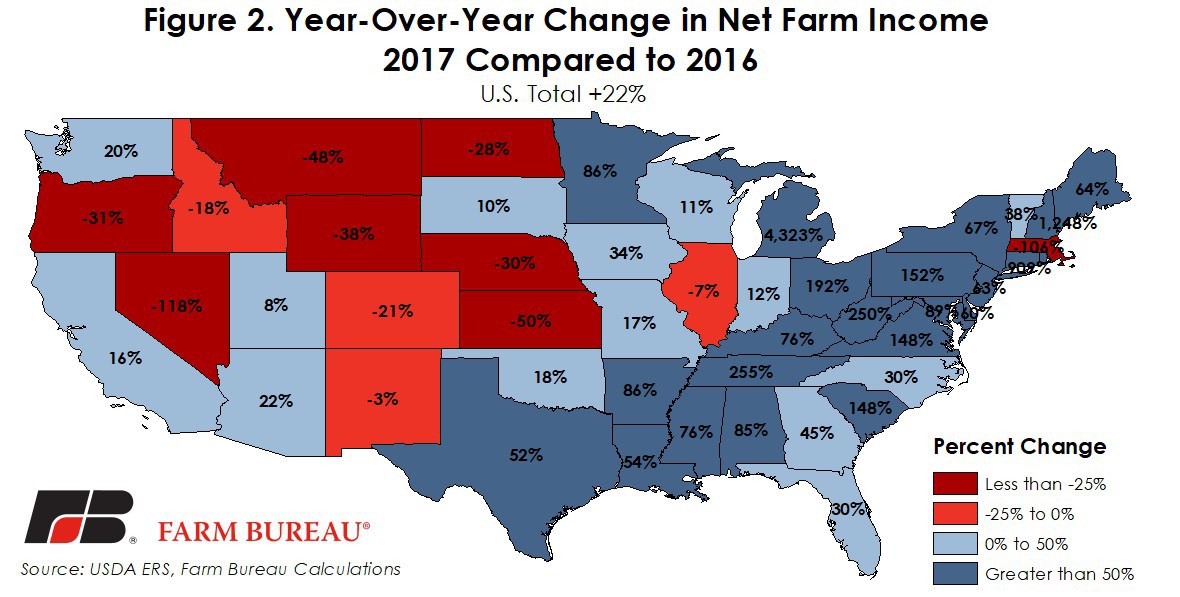
A variety of factors can change net farm income year-over-year including higher or lower productivity, regional differences in cash prices, fewer government payments or changes in inventory. While in aggregate the U.S. saw an increase of 22 percent in net farm income in 2017, 12 states experienced lower net farm income in 2017, ranging from -3 percent in New Mexico to -118 percent in Nevada, where net farm income went from a positive in 2016 to a negative in 2017.
The increases in net farm income ranged from 8 percent in Utah to 1,000 percent in New Hampshire and Michigan. Figure 2 highlights the year-over-year change in state-level net farm income.
Comparison to Previous Decade
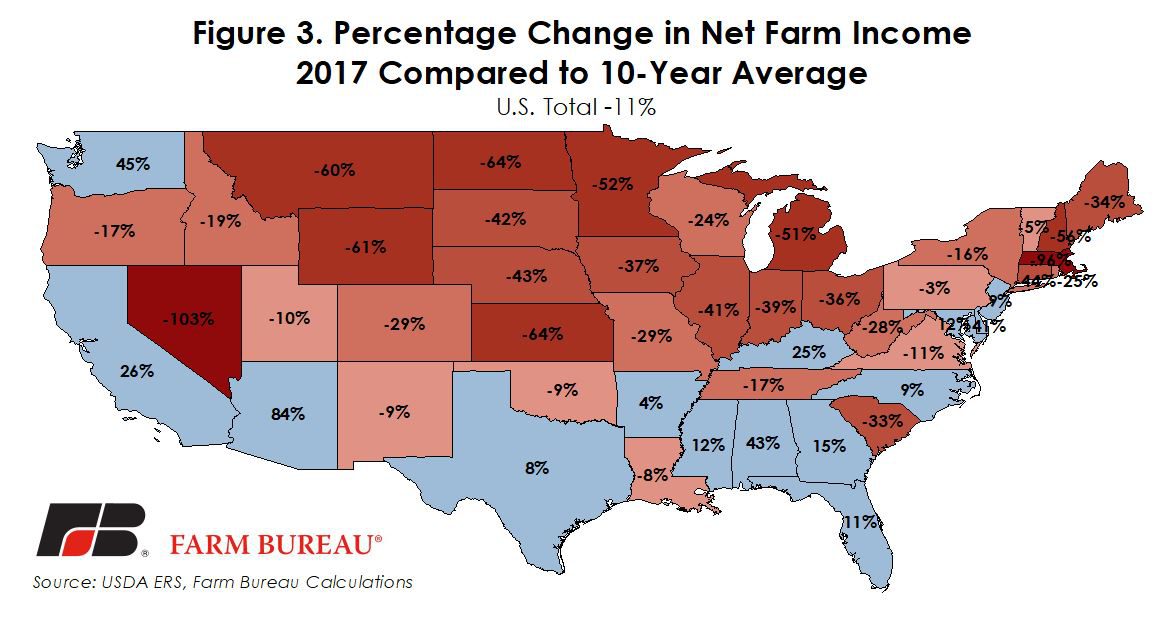
At the national level, 2017’s net farm income of $75.5 billion was 11 percent, or $10.2 billion, below the 10-year average. A comparison of 2017’s net farm income to the 10-year average reveals that only 14 states saw higher net farm income than over the previous decade. Net farm income in Arkansas was 4 percent above the 10-year average while net farm income in Arizona was 84 percent over the 10-year average.
More than 30 states saw lower net farm income in 2017 compared to the prior decade. In Pennsylvania, net farm income was only 4 percent lower than the prior decade average. However, in 10 states 2017 net farm income was more than 50 percent below the 10-year average. These states are Nevada, Massachusetts, Kansas, North Dakota, Wyoming, Montana, New Hampshire, Minnesota, Michigan and Connecticut. Figure 3 identifies the change in net farm income in 2017 compared to the previous decade.
Summary
While many states saw higher net farm income in 2017 compared to 2016, 35 states had net farm income below their 10-year average – further emphasizing the downturn in the farm economy. U.S. net farm income in 2017 was $48 billion lower than the highs experienced in 2013, and $10 billion below the 10-year average.
Many states have seen billion-dollar erosions in net farm income compared to the 10-year average. For example, in 2017, net farm income in Nebraska, Kansas, Iowa and Minnesota was $2 billion less than the 10-year average. Those are dollars that are not invested in rural agricultural communities. This year is likely to be more of the same for farmers in these states as USDA recently estimated 2018 net farm income at $65.7 billion — down 13 percent from 2017 and $58 billion below 2013.
Top Issues
VIEW ALL