September WASDE Increases Corn, Soybean and Cotton Production, Drops Wheat Production

photo credit: Arkansas Farm Bureau, used with permission.
Shelby Myers
Former AFBF Economist
The monthly World Agricultural Supply and Demand Estimates, released today by USDA’s Office of the Chief Economist, increased corn supply for the start of the new marketing year, largely driven by the 600,000 additional acres farmers planted. USDA dropped the soybean supply due to a 400,000-acre decrease in soybeans planted but bumped up the cotton supply despite a 530,000-acre decrease. Yield expectations for corn and soybeans were increased by 1%, while cotton yield expectations increased by 12% compared to last month’s report. Wheat yields remain unchanged compared to last month.
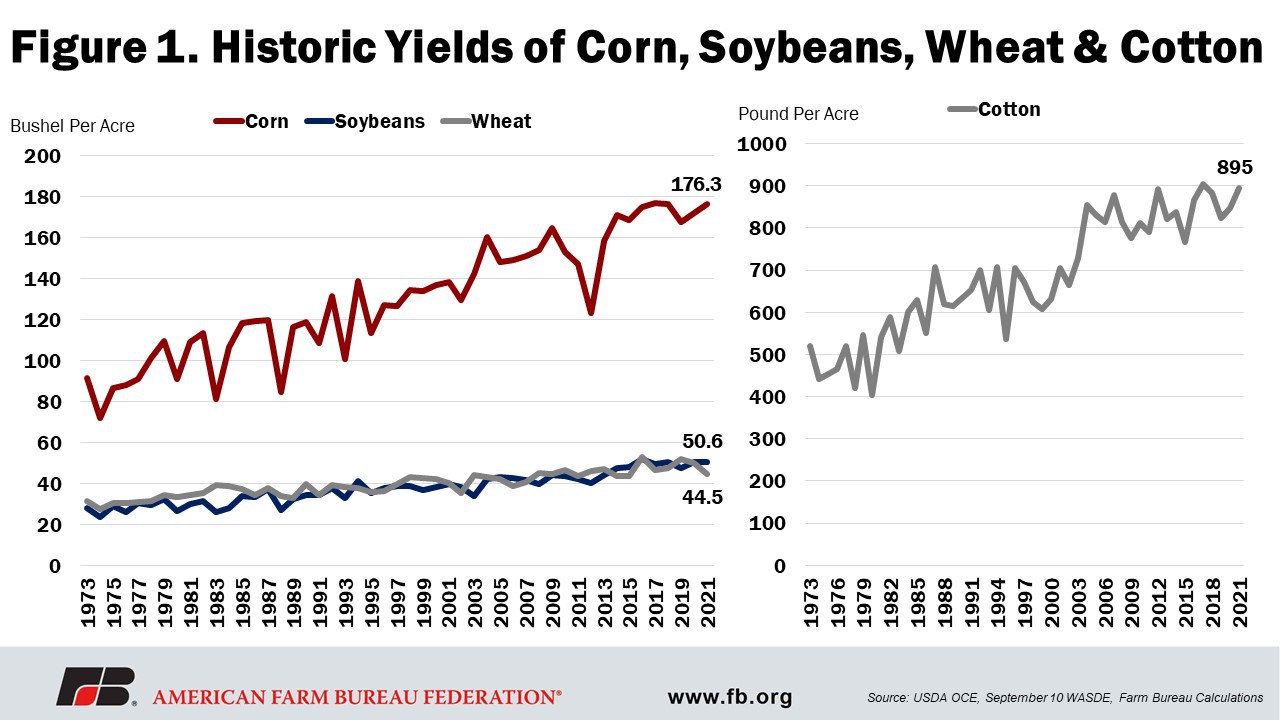
Figure 1 is historic yields for corn, soybeans, wheat and cotton since 1973 with 2021 estimates highlighted.
Corn
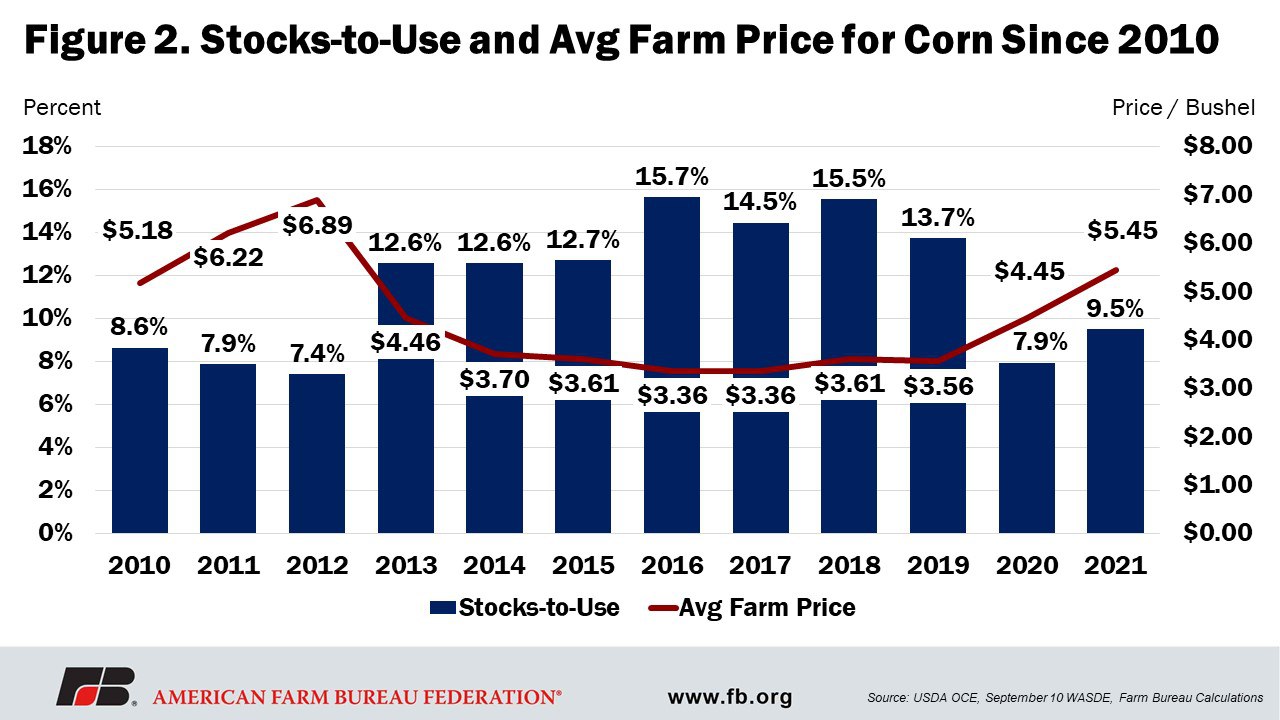
For the close of the 2020/21 corn marketing year, a decrease of 40 million bushels in ethanol use and a decrease of 30 million bushels in corn exports pushed USDA’s ending stocks estimate 6% higher to 1.18 billion bushels from the August estimate of 1.11 billion bushels. USDA estimates the 2020/21 marketing year price to be $4.45 per bushel, up 5 cents compared to August and up 25% compared to 2019. The stocks-to-use ratio of 7.9% is cut nearly half from where it was in 2019 and is the lowest stocks-to-use ratio since 2012.
For the new 2021/22 corn marketing year that started Sept. 1, USDA indicates that corn farmers planted 600,000 more acres of corn than what was reported in the June 30 Acreage report, moving corn area planted to 93.3 million acres, up 2.8% compared to 2020. This estimate, in conjunction with an increase in yield from 174.6 bushels per acre reported in the August Crop Production Survey report to 176.3 bushels per acre -- a 2.5% increase compared to 2020, increases corn production for the year from 14.75 billion bushels to almost 15 billion bushels. This is about where USDA anticipated production to be when estimates were first reported in May of this year and is 5.7% higher than corn production in 2020. With the corn carry-over quantity increased as well, USDA reported corn supply to be 16.2 billion bushels, up less than 1% compared to 2020.
For corn demand, USDA increased the feed and residual use category by 75 million bushels, from 5.625 billion bushels to 5.7 billion bushels, down less than 1% compared to 2020, and increased corn exports by 3%, from 2.4 billion bushels to 2.475 billion bushels, which is just less than 10% under 2020 levels. 2021/22 ethanol use is on track for a 3.3% increase at 5.2 billion bushels compared to 2020/21 when ethanol use was only at 5 billion bushels. Adjustments made to supply and demand this month caused ending stocks to rise 166 million bushels, from 1.24 billion bushels to 1.4 billion bushels, up 18% compared to 2020 ending stocks. This also pressured the 2021/22 marketing year average farm price for corn to lower from $5.75 per bushel last month to $5.45 per bushel – a full $1.00 per bushel above the corn price in the 2020/21 marketing year.
Figure 2 shows the corn stocks-to-use ratio and corresponding price since 2010.
Soybeans
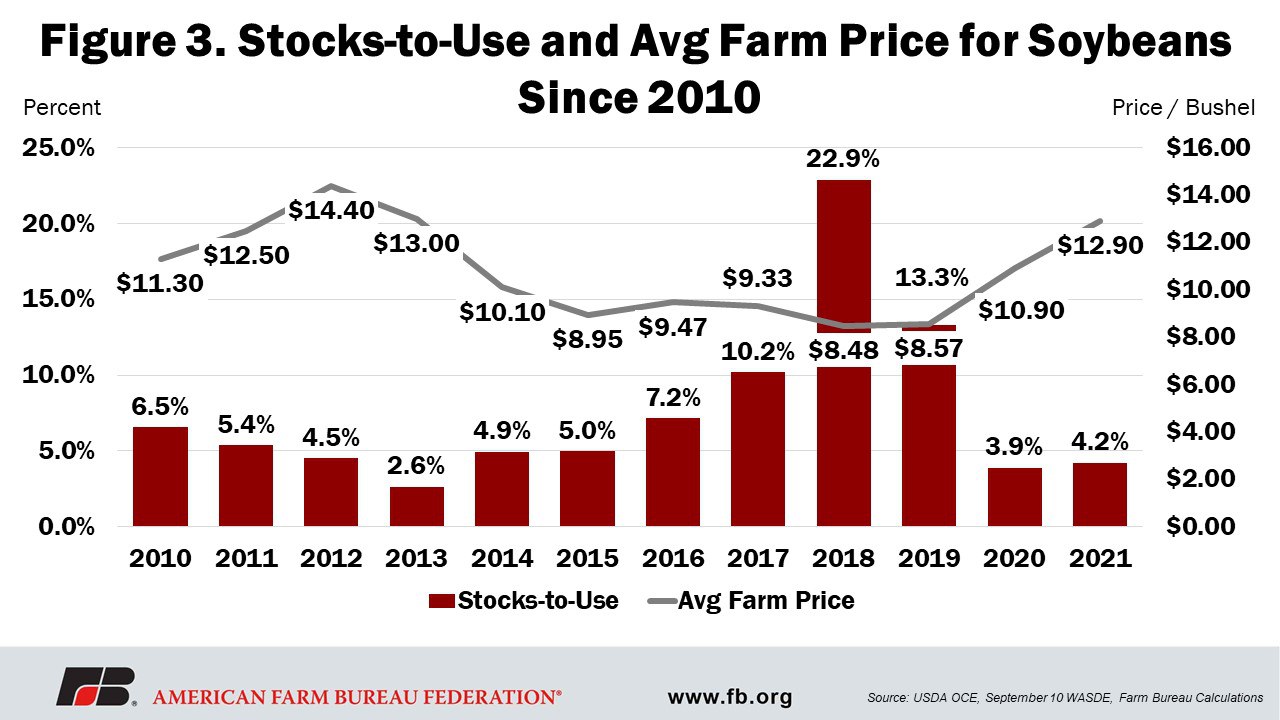
At the close of the 2020/21 marketing year, USDA lowered soybean crushing by 15 million bushels to 2.14 billion bushels and lowered export estimates for soybeans by 10 million bushels to 2.26 billion bushels. The adjustments made in demand also increased ending stocks from 160 million bushels last month to 175 million bushels in September. The stocks-to-use ration increased from 3.5% to 3.9%, however the average farm price for soybeans in the 2020/21 marketing year remained at $10.90 per bushel, a 27% increase in soybean price compared to 2019.
The new soybean marketing year for 2021/22 started Sept. 1 and USDA estimates indicate soybean farmers decreased planted acres by 400,000 acres compared to the June Acreage report. This means that soybean planted area moved from 87.6 million acres to 87.2 million acres, which is just under a 5% increase compared to 2020 planted acreage. USDA made a slight yield bump, returning soybean yields to 50.6 bushels per acre compared to the 50 bushels per acre reported last month in the August Crop Production Survey and just below early estimates in May that soybean yields would be 50.8 bushels per acre. Soybean yields at this level are tied for highest on record with 2018 when 50.6 bushels per acre was the final recorded yield for the year. The yield bump also helps offset the decrease in soybean acres planted, resulting in a soybean production estimate of 4.3 billion bushels, up 5.8% compared to 2020. However, given the lowest carry-over soybean stocks quantity since 2013, soybean supply for 2021 is on track to only reach 4.5 billion bushels, about 2.3% lower than 2020.
Soybean demand estimates for 2021 were revised in September compared to August as USDA lowered soybean crushing use by 25 million bushels to 2.18 billion bushels, which is still almost 2% higher than 2020 crushing, but increased soybean exports by 35 million bushels from 2.05 billion bushels to 2.09 billion bushels. However, soybean exports are on track to be about 7.5% behind the 2020 record-breaking 2.26 billion bushels. Adjustments made to supply and demand in this month’s report pushed ending stocks from 155 million bushels to 185 million bushels, which is 5.7% higher than ending stocks reported for 2020. The 2021/22 marketing year average price for soybeans is running at $12.90 per bushel, down 80 cents, or 6%, compared to last month, but running a full $2.00 per bushel above the 2020/21 marketing year average price.
Figure 3 shows the soybean stocks-to-use ratio and corresponding price since 2010.
Wheat
USDA has kept wheat planted acreage consistent across the 2021/22 marketing year at 46.7 million acres, about 5% more than the number of acres of wheat planted in 2020. Yields this month remained unchanged compared to the August estimates at 44.5 bushels per acre. This is slightly lower than estimates from earlier in the year when 50 bushels per acre were expected, likely impacted by drought-stricken areas, and about 10% behind where yields for wheat sat in 2020 when farmers were reporting 49.7 bushels per acre. Wheat production in 2021 is estimated by USDA to be just under 1.7 billion bushels, about 7% behind production in 2020 when wheat production reached above 1.8 billion bushels. The only revision made by USDA this month was to lower wheat imports from 145 million bushels to 135 million bushels, which is about 35% above the 100 million bushels of imported wheat that occurred in 2020, but matches 2018 imports. USDA estimates total U.S. wheat supply to be at 2.6 billion bushels in 2021, which is 9% behind the 2020 wheat supply of 2.9 billion bushels and 14% behind the 2019 wheat supply of 3.1 billion bushels.
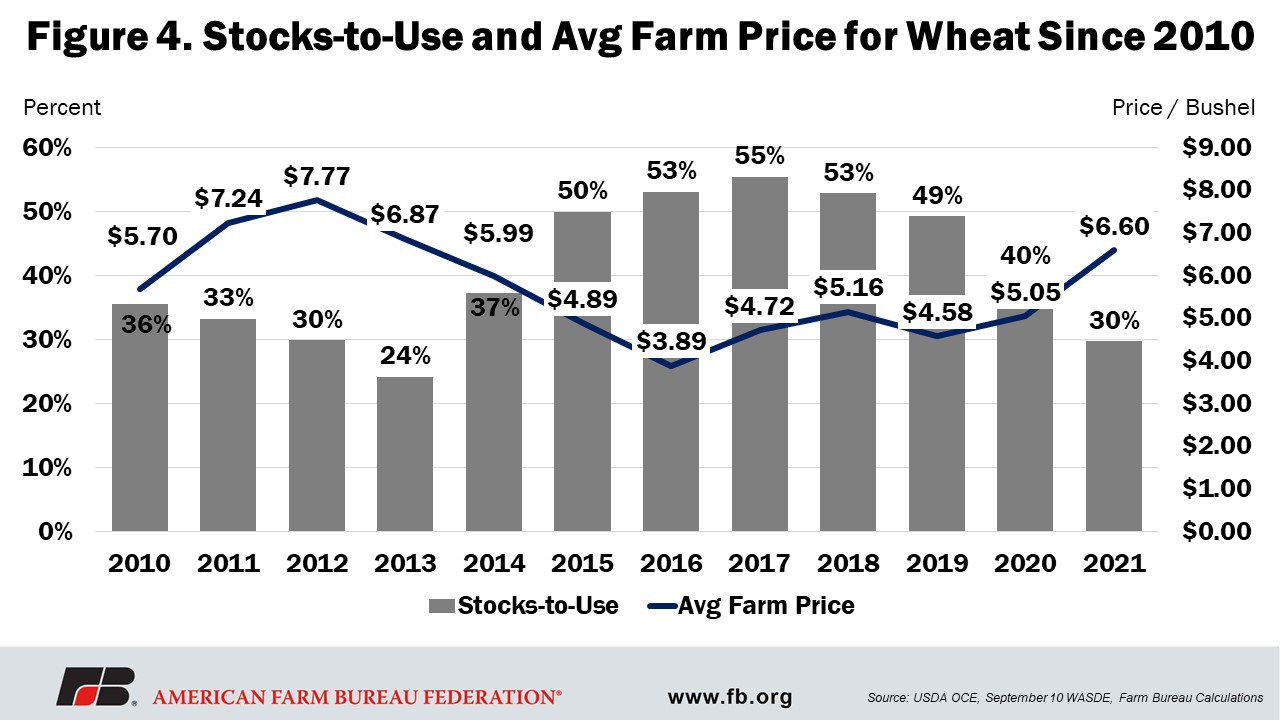
On the demand side for 2021/22 marketing year wheat, food use for wheat is matching 2020 and 2019 levels of close to 964 million bushels and seed use is in line with 2019 and 2020 levels as well, close to 62 million bushels. Wheat exports from the U.S. are running about 12% behind 2020 levels, with only 875 million bushels expected to be exported in the 2021/22 marketing year compared to 992 million bushels exported in the 2020/21 marketing year. This is likely an impact from the increase in feed use. USDA estimates show wheat used for feed has jumped 65% from the 2020/21 marketing year when feed use was 97 million bushels to the 160 million bushels for feed use in the 2021/22 marketing year. Evidence of the shift in feed use is in the ending stocks estimate, which USDA puts at 615 million bushels – 27% lower than in 2020 when ending stocks for wheat were 844 million bushels. The stocks-to-use ratio for wheat in 2021/22 currently sits at 30%, which is 10% lower than in 2020/21. USDA estimates the average farm price for wheat in 2021/22 is $6.60 per bushel, up 10 cents from initial estimates for the marketing year early this spring and up $1.55 per bushel compared to 2020.
Figure 4 shows the wheat stocks-to-use ratio and corresponding price since 2010.
Cotton
The 2021/22 marketing year for cotton began on August 1 and the yield increase reflected in the September WASDE indicates significant weather improvements. On the supply side, USDA revised cotton area planted down from 11.72 million acres in August to 11.19 million acres, which is down almost 7.5% compared to the 12.09 million acres planted in 2020. With the revised 2021/22 yield bump from 800 pounds per acre in August to 895 pounds per acre, which is 5% higher than yields in 2020, USDA estimates cotton production to reach 18.5 million 480-pound bales, an increase of 26.7% compared to 2020 when production only reached 14.6 million 480-pound bales, and up from last month’s estimate by 7.24%. With the carry-over stocks of 3.15 million 480-pound bales, the lowest since 2013, cotton supply in 2021/22 is on track to reach 21.66 million 460-pound bales, which is about 1% below total supply in 2020.
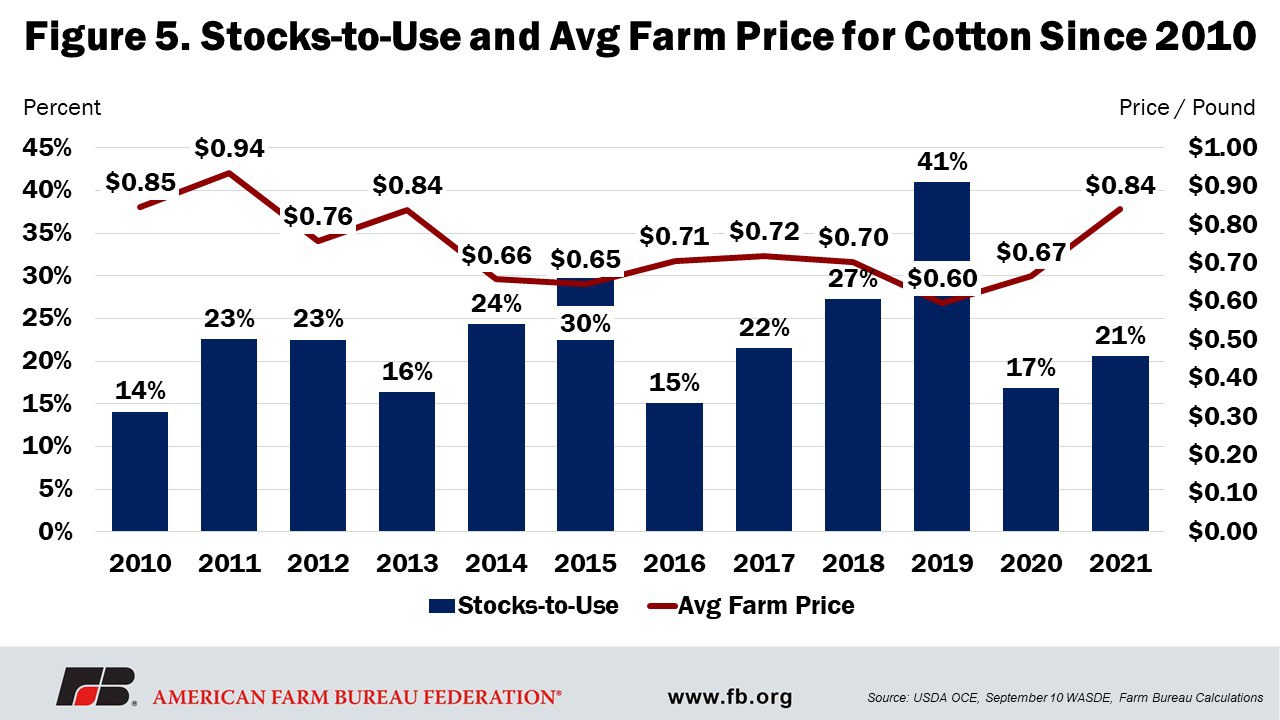
On the demand side for cotton, domestic use remained unchanged from August at 2.5 million 480-pound bales, an increase of 6% compared to 2020. However, estimates for cotton exports increased 500,000 480-pound bales from August to September, now registering 15.5 million 480-pound bales, which is still pacing about 5% behind exports in 2020 when 16.37 million 480-pound bales were exported. The adjustments made in supply and demand pressured ending stocks upward from 3 million 480-pound bales in August to 3.7 million 480-pound bales, which is 17% higher than in 2020. The stocks-to use ratio for the 2021/22 marketing year sits at 20.5%, up just under 4% compared to 2020. However, the average farm price for cotton increased 4 cents from August to September and now sits at 84 cents per pound, up 26% from prices received in the 2020/21 marketing year.
Figure 5 shows the cotton stocks-to-use ratio and corresponding price since 2010.
Summary
In its September WASDE, USDA applied its objective yield plot results to crop production estimates, resulting in increased yield estimates for corn, soybeans and cotton for the 2021/22 marketing year, while leaving wheat unchanged. Additionally, corn and soybean production are both up just over 5% compared to 2020 production levels, while cotton production is up almost 27% compared to 2020, but wheat production is down 7% compared to 2020.
The resulting supply changes loosen what have been consistently tight margins throughout the year as demand-side categories for all four commodities also saw slight bumps. Ending stocks for corn, soybeans and cotton all slightly increased in September estimates compared to August, thus relieving the high pressure on prices. What might come as a surprise to many is the increase in yields, especially compared to last month when farmer survey results indicated lower yields for these commodities, and particularly as it relates to drought-stricken areas. Loosened margins, however, may put a pause on rising commodity prices that have been occurring throughout the year.
Top Issues
VIEW ALL