Strong Dairy Prices Overshadowed by Farm Operating Expenses
TOPICS
Milk Prices
photo credit: AFBF
Daniel Munch
Economist
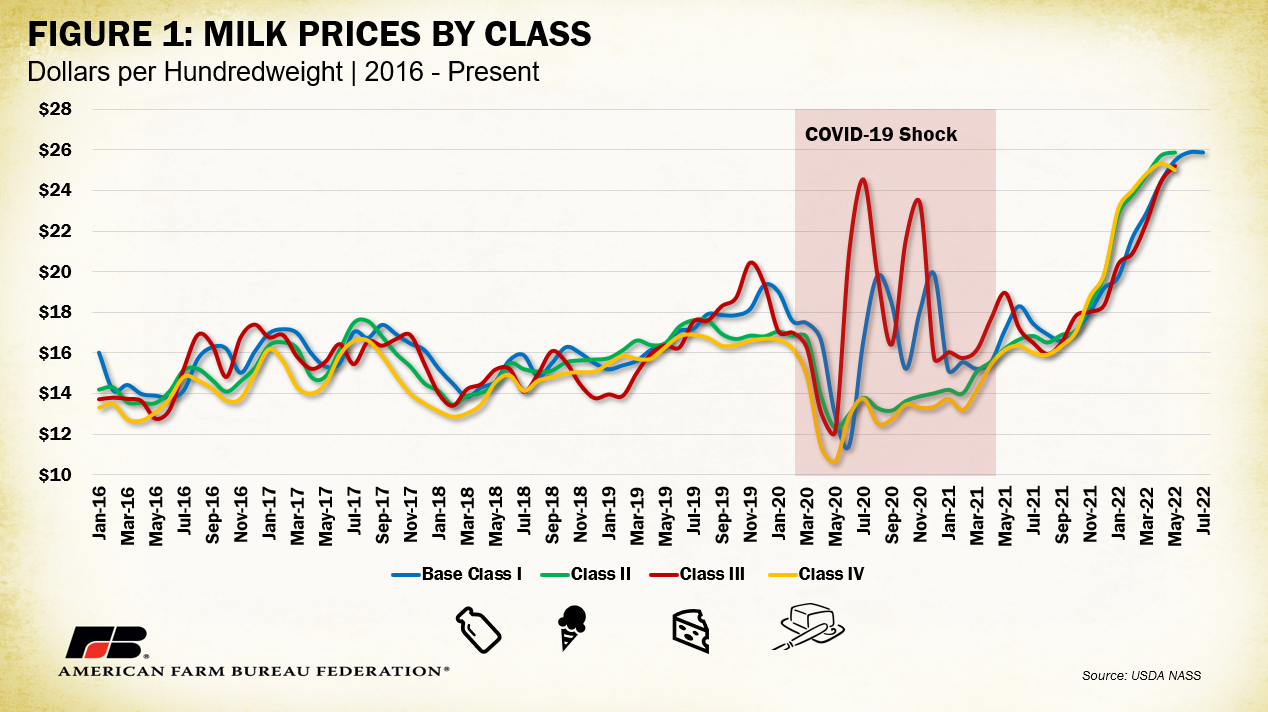
By prices alone, the past year or so has gone well for dairy producers. In March, USDA reported the highest-ever average all-milk price at $25.90 per hundredweight, 20 cents ahead the previous record set in September 2014. The all-milk price represents the gross price farmers receive, sold at an average fat test, before deductions for items such as hauling, advertising, stop charges, promotional costs and cooperative membership dues. Between May 2021 and May 2022, the base Class I (fluid milk) price increased by $8.35 (49%), the Class II (soft products like ice cream and yogurt) price increased by $9.65 (59%), Class III (hard cheeses and whey) prices increased by $6.25 (33%), and Class IV (butter and powders) prices increased by $8.83 (55%) per hundredweight. These prices, as displayed in Figure 1, have been on a seemingly unstoppable climb until the last two price reports, which indicated stable prices or marginal drops. The frequent and volatile price spreads between classes that defined the onset of COVID-19 in the marketplace appear to have receded. The four class prices, for now, are moving in a more clustered and correlated manner.
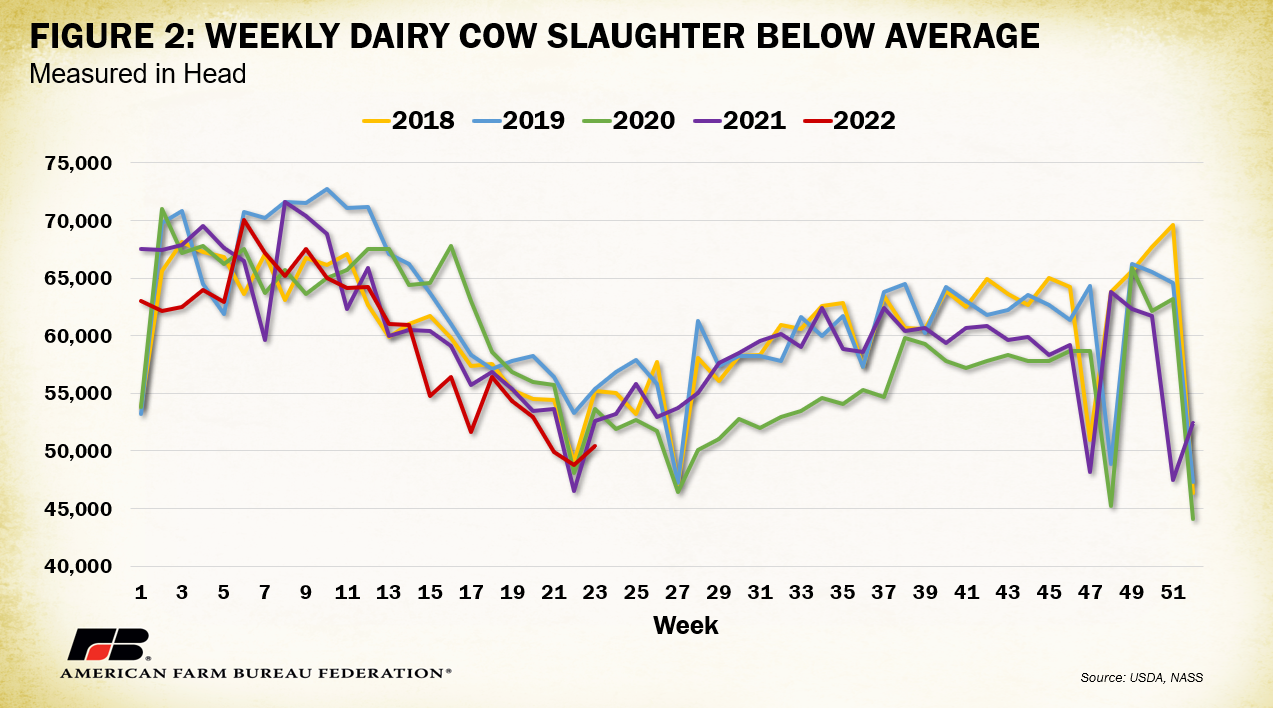
These high prices are a result of factors on both the supply and the demand fronts. Declines in the national herd, or total inventory of milking cows, and an accompanying decline in milk production defined much of 2021. Since the beginning of 2022, however, the dairy herd has marginally recovered, moving from 9.37 million head in January to 9.405 in the latest report for May; this is in line with the previous five-year average for May of 9.39 million head. Quarterly national milk production between quarter one of 2021 and quarter one of 2022 dropped 0.86% or 489 million pounds, with quarterly milk production per cow down 3 pounds per cow, or 0.05%, during the same timeframe. Dairy cow slaughter in early June (Figure 2) was 6% lower than the prior five-year average but 3% higher than last month. The slight recovery in the milk herd and comparative decline in slaughter suggests production may slightly increase as we deepen into the flush months – though not proportionally to the magnitude of high prices.
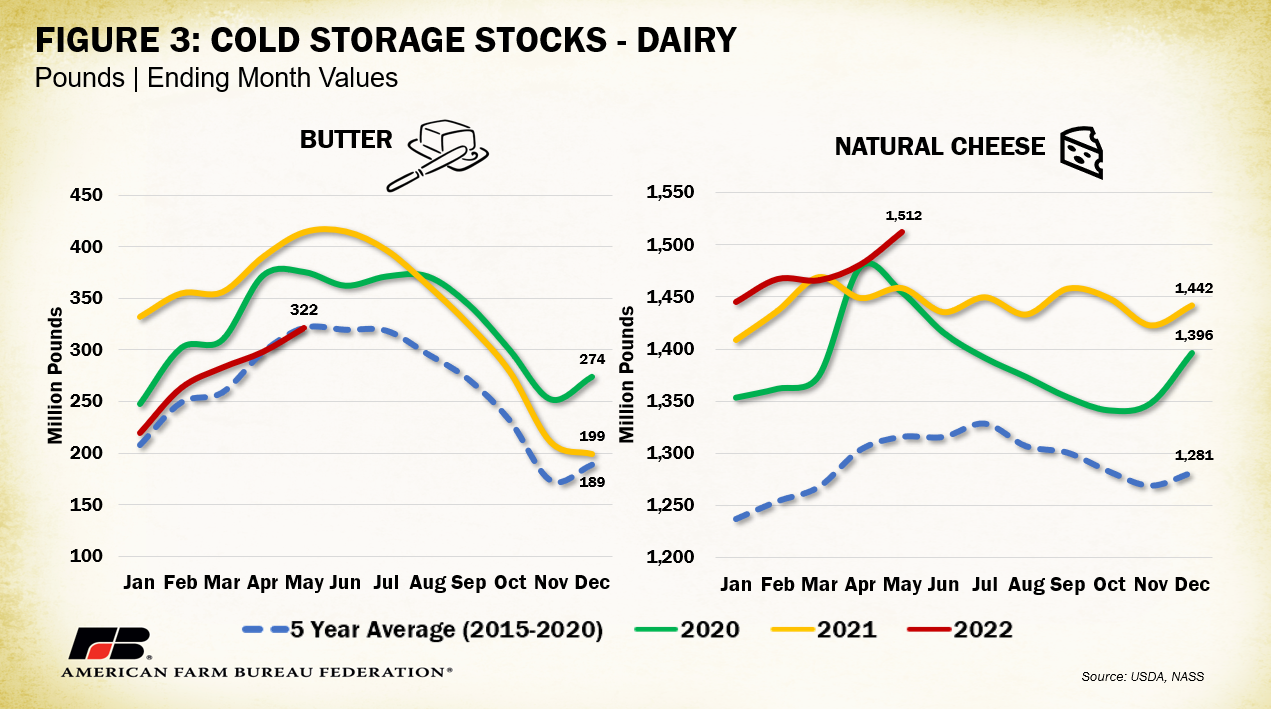
On the demand side, prices originally lifted as various facets of the economy such as restaurants, schools and leisure travel rushed back, bringing demand for large quantities of dairy products with it. May butter stocks in cold storage in 2020 were 17% above, and in 2021 were 28% above, the 2015-2020 average, when drops in food service orders led to increases in stored product. The May 2022 Cold Storage Report shows butter stores have dropped back to the 2015-2020 average exactly at 322 million pounds with markets foreign and domestic quickly consuming the cumulated excess. Natural cheese cold stocks, which initially experienced a strong decline as consumers looked for cheeses via retail outlets in 2020, have since recovered on the backs of increased processing capacity. May cold stores of natural cheese were 15%, or 196 million pounds, higher than the 2015-2020 average and 4%, or 54 million pounds, higher than last May. Domestic consumption of cheese has continued to increase with 123 million additional pounds consumed between January 2022 and April 2022 over the same period last year, a 5% jump. Time will tell if the range of new cheese processing plants will outpace demand and hamper Class III prices.
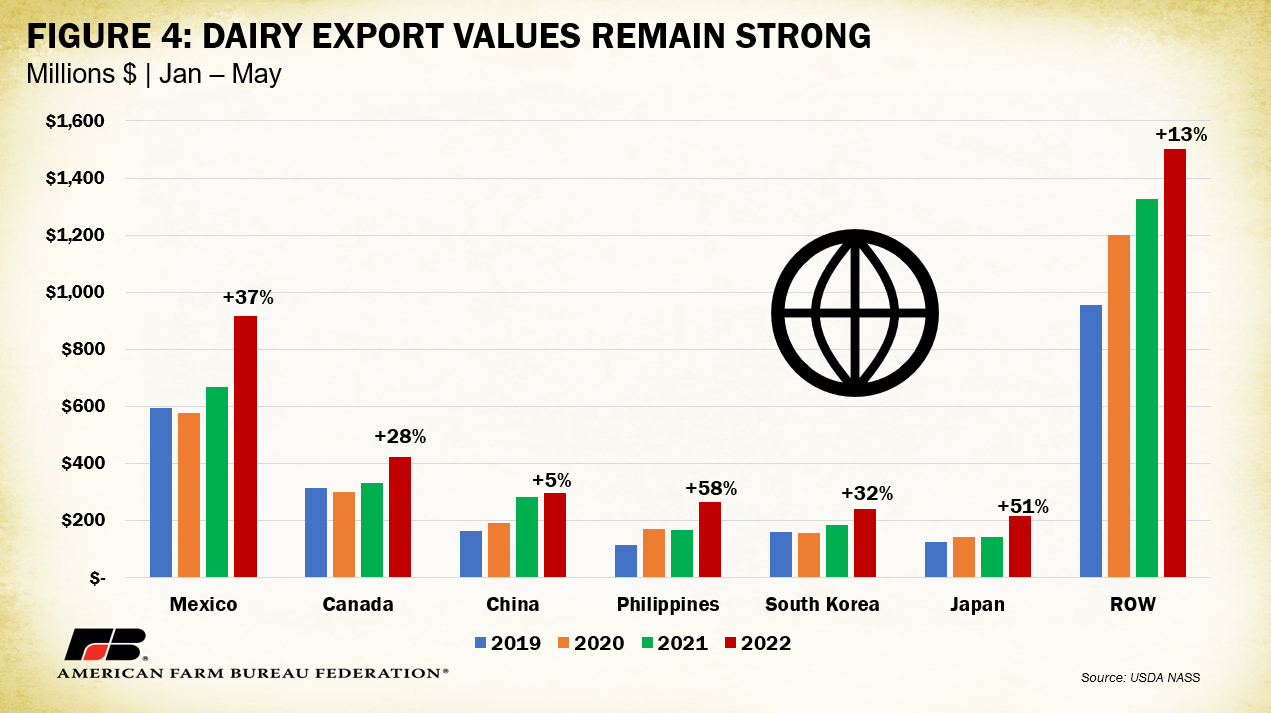
Exports remain relatively strong across the board for U.S. dairy products. In the first five months of the year (January-May), the U.S. sent $3.860 billion worth of dairy products across borders, a 25%, or $761 million, increase from last year. This translated to 1.162 million metric tons of dairy product exported from U.S. borders, about 15,000 metric tons more than last year, which is only a 1% increase in volume. The discrepancy between value increase and volume increase reveals the magnitude of price increases year-over-year. Mexico continues to lead as our top export customer, purchasing $915 million worth of dairy products in the first five months, including $485 million in non-fat dry whey (+37% YOY) and $233 million in cheese and curds (+36% YOY). Canada retained its second-place spot in terms of value with $424 million in purchases including $52 million in butter and milkfat (+25% YOY). China claims the third-place spot in value with $298 million worth of dairy products, including $99 million in whey (-16% YOY), but outpaced Canada in volume by 81,000 metric tons. Given that high prices explain the majority of increases in dairy products export value so far, any future increase in domestic production could risk those increases unless volume demand picks up internationally – which appears unlikely as a potential recession looms.
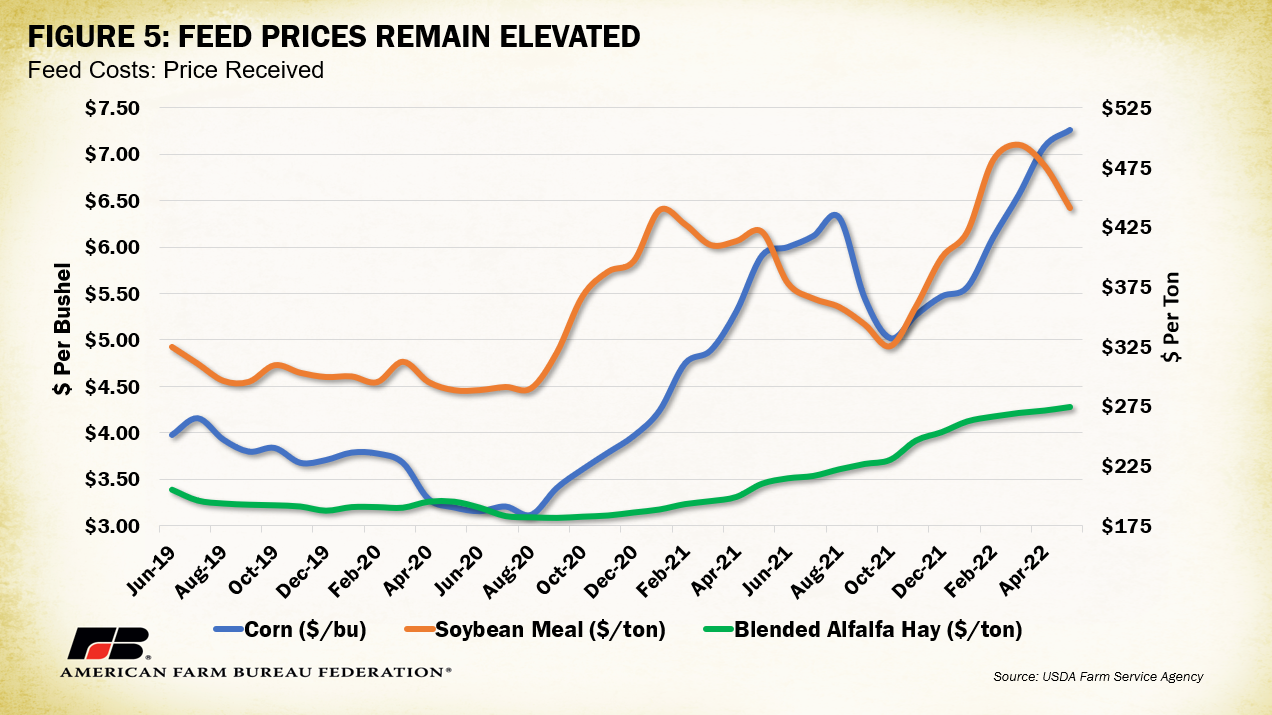
The record prices at the mailbox have largely been dwarfed by increases in production costs. Feed costs, even with some recent declines, remain well above average. Uncertainty surrounding crop supply expectations globally continue to apply upward pricing pressure. As of May 2022, the average corn feed costs used to calculate the Farm Service Agency’s Dairy Margin Coverage Program margin was 22% higher than last year ($5.91/bu to $7.26/bu), the average soybean meal cost was 5% higher ($421/ton to 441/ton) and the average blended alfalfa price was 5% more ($210/ton to $274/ton). Severe Western drought continues to stress hay production with little sign of relief. Notably, the average DMC margin (above feed cost margin) between the program’s launch in January 2019 and December 2020 was 52% of the all-milk price. Since December 2020 the DMC margin has come in at 40% of the all-milk price. Dairy farmers are keeping proportionally less of their milk check under these periods of high milk prices, revealing the impacts of inflationary price pressures on the value of revenue. Though the number on the check is higher, its value and buying power in the broader market has weakened
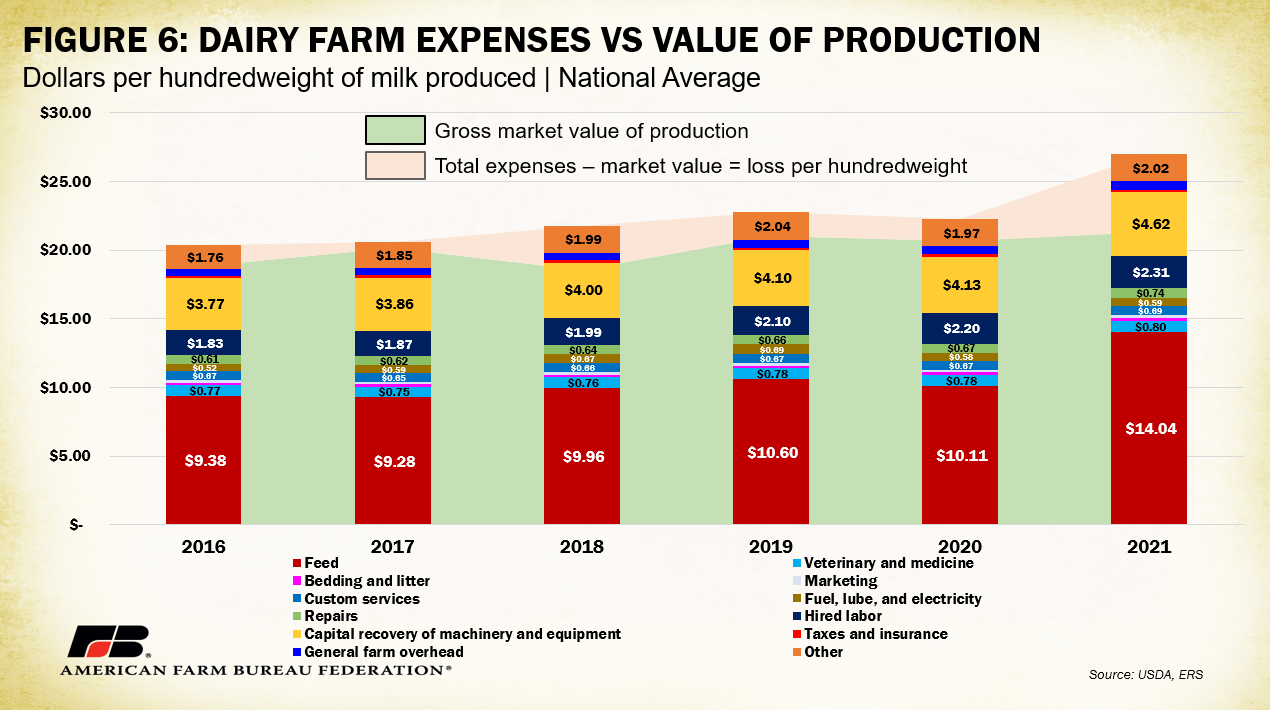
Analyzing production and operating costs on the dairy farm more deeply further highlights this margin problem. USDA’s Economic Research Service runs biannual milk cost of production estimates nationally and for about 20 states. Though numbers for 2022 will not be available for some time, 2021 can serve as a proxy for describing the extent to which operating costs have largely outpaced market values of dairy production under more recent market conditions. Figure 6 displays common dairy farm expenses between 2016 and 2021 in dollars per hundredweight of milk produced. Feed, including purchased feed, homegrown feed and grazed feed has taken up the largest portion of expenses, ranging from $9.28/cwt in 2017 to $14.04/cwt in 2021- a shift from 45% of total expenses to 52%. By state, West Coast dairies experienced the largest increase in feed costs, with Oregon feed costs up 46% ($5.43/cwt), California feed costs up 45% ($4.28/cwt) and Washington feed costs up 26% ($4.75/cwt) year-over-year. Exceptional drought in these states throughout much of last year was a likely culprit. The second-highest category is capital recovery of machinery and equipment, which includes investments in housing, manure handling, feed storage structures and the breeding herd. Capital recovery refers to the earning back of initial funds put into an investment, which will be considered negative until that investment is recouped. In 2021 capital recovery cost dairy farmers an average of $4.62/cwt or 17% of all expenses. Hired labor, another costly piece of the equation, has increased by 12% since 2016 ($1.83/cwt to $2.31/cwt) and is highest in Oregon, Maine and Vermont, states with comparatively stringent farm labor regulations.
Figure 6 also displays the average gross market value of production in green to represent the market value of goods produced and sold by dairy farms. This includes income from milk sales, cattle sold, leasing stock, renting space to other operations, cooperative patronage dividends and the fertilizer value of manure. In red is the difference between the total average production expenses and average gross market value of production i.e., the loss per hundredweight dairy farmers, on average, have had to absorb each year to remain in business. In 2021, for each $27.02/cwt spent, dairy farmers received only $21.33/cwt, a loss of $5.69/cwt. This is the largest loss within the timeframe analyzed. Between 2020 and 2021 the loss increased by 233%, going from -$1.60/cwt to -$5.69. These estimates can also be broken down by farm size and, for 2021, yielded a negative margin across all size categories ranging from fewer than 50 cows to over 2,000 cows. For farms with fewer than 50 cows the magnitude of loss was far greater at -$19.90/cwt vs -$3.18/cwt for farms with over 2,000 cows. A comprehensive breakdown of dairy farm production cost estimations by farm size can be accessed here.
Conclusion
A quick glance at the dairy market’s high prices and decent demand signals might suggest dairy farmers are in good shape. Unfortunately, analyzing milk prices only by comparing their face value over time is futile to understanding the breadth of challenges facing dairy farmers across the country. Persistent high costs across the expense spectrum continue to challenge dairy farm solvency; these costs are further exacerbated by inflationary pressures that have lowered the real value of a higher milk check. The impending recession could spell trouble on the demand front if consumers begin to spend less and go out less, actions that would be compounded by increases in milk production. For now, production appears to have mellowed with high production expenses and pending government regulations across global economies continuing to discourage future milk expansion.
Top Issues
VIEW ALL