Three Months In: Early Impacts of FMMO Amendments
TOPICS
Federal Milk Marketing Order
Daniel Munch
Economist
For those following dairy policy, the last few months have felt relatively quiet compared to the marathon debates of the most recent Federal Milk Marketing Order (FMMO) hearing. As of June 1, all but one of USDA’s amendments to the FMMO structure went into effect across the 11 orders, giving us our first three months of pricing data to evaluate.
Among the most hotly debated changes, higher make allowances have, as expected, reduced the prices farmers receive for their milk. In the first three months under the new rules, farmers lost more than $337 million in combined pool value, with Class price reductions ranging from 85 to 93 cents per hundredweight. While lower feed costs helped cushion margins over the past year, recent price declines may soon push the spotlight back onto the economic impacts of these FMMO adjustments. This Market Intel reviews the results of FMMO implementation so far.
Background
On Jan. 17, after separate farmer referenda held in each of the 11 FMMOs obtained the necessary two-thirds votes in favor of adoption, USDA published their final rule to amend the FMMO system. This capped a long process that included a five-month hearing in Carmel, Indiana, where dairy stakeholders testified on how to modernize FMMOs to reflect current marketing conditions, followed by months of briefs, comments and decisions. The FMMO framework governs how processors purchase milk from farmers in defined marketing areas including setting minimum uniform prices paid to farmers.
Of the five major amendments to the FMMO system (increased make allowances; a return to the higher-of Class I mover; higher Class I differentials; removal of 500-lb barrel cheese from the pricing survey; and updated milk composition factors), all but the composition factor changes took effect on June 1. Detailed reviews of the proposed rule, final rule and referendum process are linked.
Make Allowances
Transforming raw milk into dairy products like cheese requires more than milk alone; factors such as labor, cultures, salt, energy, testing and packaging all add to the cost. In the FMMO pricing system, these processing costs are represented as fixed deductions per pound of product produced, known as make allowances. The larger the allowance, the lower the price returned to farmers.
Like other formula factors considered in the hearing process, USDA set make allowances based on testimony from various stakeholders. In this case, data presented was a self-selected sample of self-reported manufacturers’ cost data, not an all-inclusive, audited representation of all processors. This means selected make allowance figures may differ from actual manufacturing costs borne by processors and can artificially lower prices dairy farmers receive. This topic was explored more in-depth here.
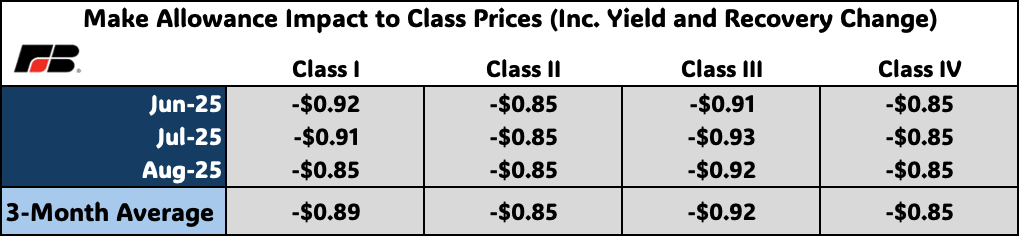
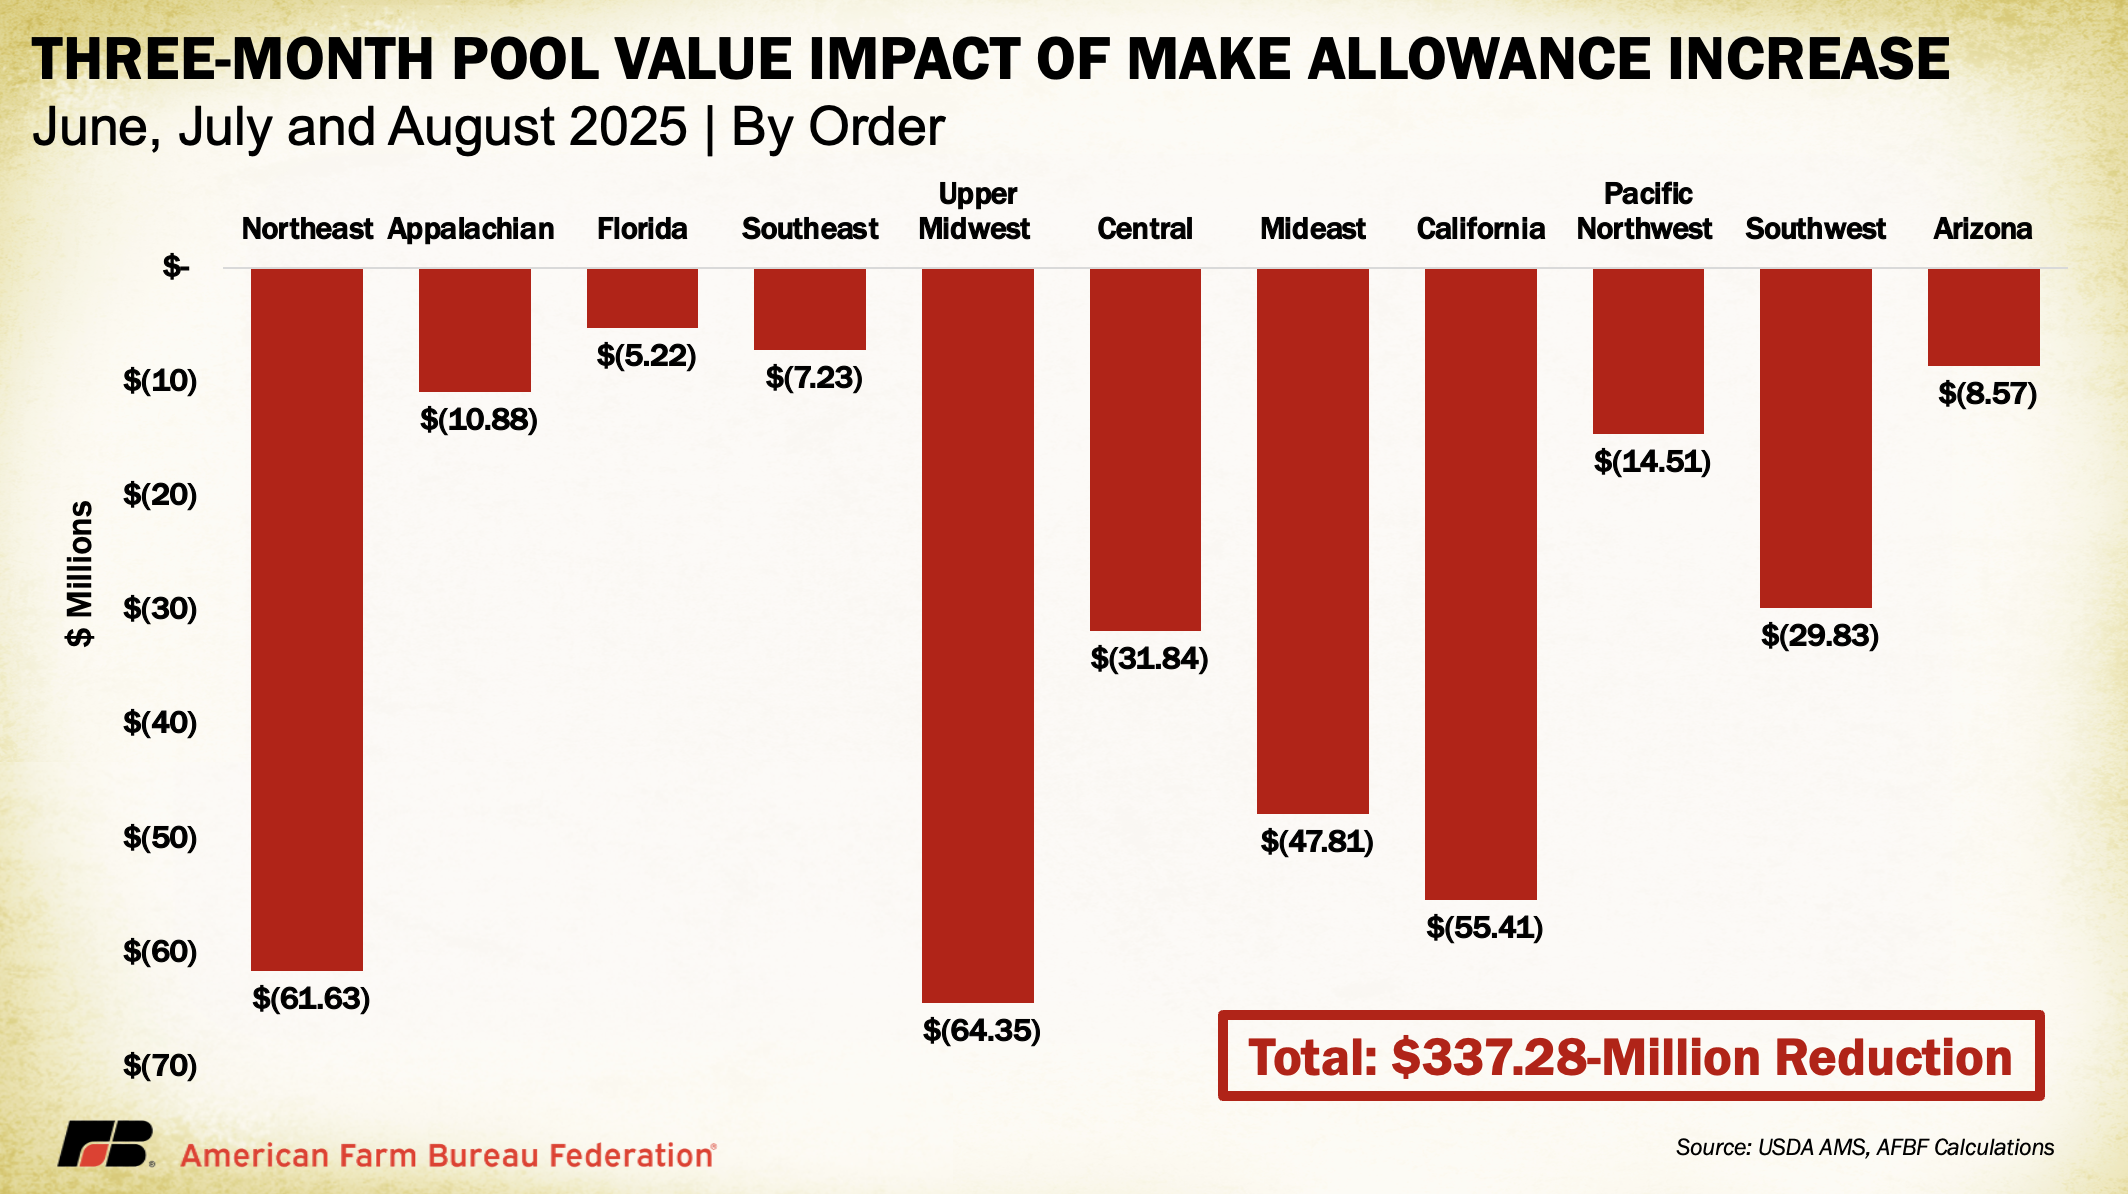
The early impacts have been significant. In the first three months under the new rule, average Class I prices were lowered by 89 cents per hundredweight, Class II by 85 cents, Class III by 92 cents, and Class IV by 85 cents — a 4–5% drop in class prices attributable solely to higher make allowances. When multiplied across pooled milk volumes, this translated into a $337 million loss in pool revenues nationwide. The largest reductions occurred in the Upper Midwest ($64 million), Northeast ($62 million) and California ($55 million), reflecting regional utilization patterns.
These losses come at a time when the dairy market is under growing pressure from softer global demand, elevated production and seasonal price weakness. While lower feed costs have provided some relief, the added hit from higher make allowances narrows margins further and could accelerate financial stress if milk prices continue to slide. In effect, the policy change amplifies downside risk in a market that was already fragile.
One encouraging development comes from the One Big Beautiful Bill Act, which requires USDA to conduct a mandatory biennial survey of dairy processors’ actual manufacturing costs for cheese, butter and nonfat dry milk. While USDA has not yet released details on methodology or timing, the survey is a critical step toward grounding future make allowance decisions in verifiable data rather than limited, self-reported samples. Importantly, even once this information is available, any future adjustment to make allowances would still require a full hearing process before USDA to implement.
Base Class I Milk Price Formula
The Class I mover sets the base price for the skim portion of milk used in fluid (Class I) products. The 2018 farm bill shifted this calculation from the “higher of” Class III or Class IV skim prices to a simple average of the two plus 74 cents, known as the “average-of” mover. After sustained advocacy from farmers and dairy cooperatives, USDA’s final rule returns the mover to the higher-of formula. The change was driven by significant pool revenue losses under the average-of method when wide spreads emerged between Class III and IV prices.
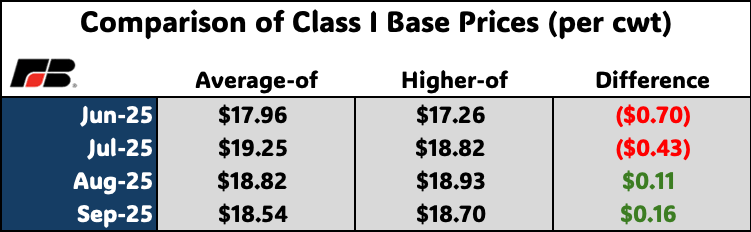
So far, the results have been mixed. In June and July, when the spread between Class III and IV prices was narrow, the average-of +74 cents formula would have produced Class I prices 70 cents and 43 cents higher, respectively, than the higher-of. By contrast, in August and September, the higher-of formula yielded prices 11 and 16 cents, respectively, above the average-of. This is expected: whenever the spread between the advanced Class III and Class IV skim milk pricing factors is less than $1.48 (twice the 74-cent adjuster), the average-of formula will be advantageous; when the spread is larger, the higher-of wins out. Across the first three months of implementation (with September pooling data not yet available), this shift translated into a $31.1 million reduction in pool value.
Because the 74-cent adjuster was set to approximate the historical difference between Class III and IV prices, the net impact of the formula shift is likely to balance out over time. The real value of the higher-of lies in periods of extreme volatility (such as during the pandemic), when it better protects dairy farmers from sharp downside risk. For that reason, farmers should not be overly concerned when, in some months, the average-of would have delivered a higher price.
USDA also added an extended shelf life (ESL) adjustor that applies to the base price of ESL milk (which makes up approximately 8-10% of the fluid milk market). Since June, the adjuster has ranged from $1.38 in its first month to a low of 53 cents in September, before rebounding to 97 cents in October. Though the adjuster has so far benefited the Class I market by adding value, its month-to-month swings introduce extra complexity to Class I pricing. For farmers, this means yet another factor outside of market fundamentals influencing their milk check, with potential for unpredictable impacts depending on how the adjuster behaves relative to baseline Class I values.
Class I Differentials
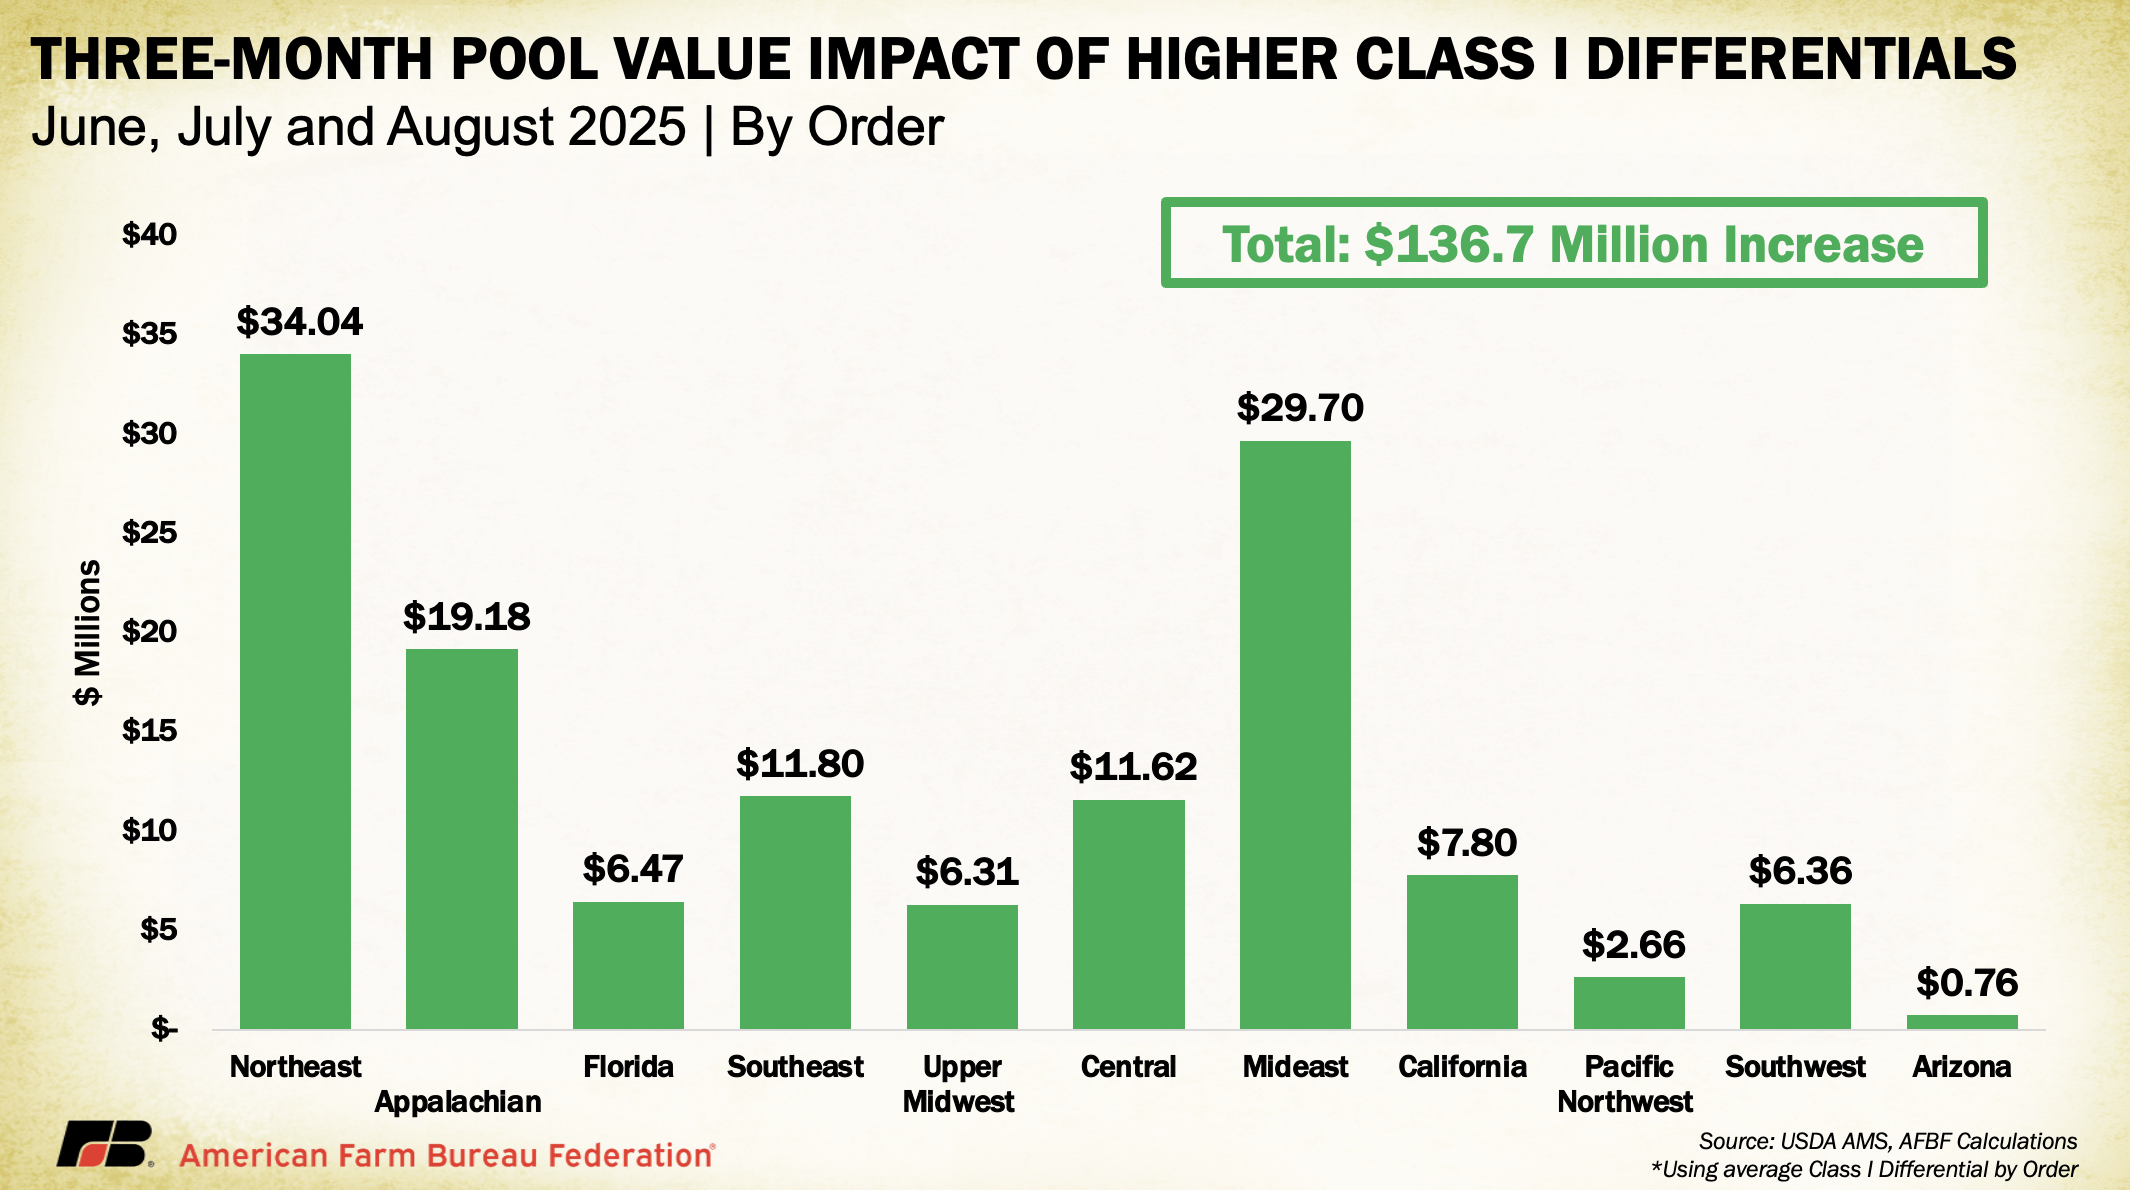
Every U.S. county is assigned a Class I location differential that reflects the region’s supply-and-demand balance and transportation costs. These differentials are added to the base Class I price to support milk production and marketing in deficit areas, where hauling costs to serve nearby processors and cities are higher. In USDA’s final rule, Class I differentials increased in most counties, averaging +$1.24 per hundredweight nationwide. Farmers generally welcomed the move, as it offsets some of the negative effects of higher make allowances, though the benefits are skewed toward orders with heavier Class I utilization.
In June, July and August, these differential changes boosted estimated pool values by $137 million, led by the Northeast (+$34 million) and Mideast (+$30 million). By contrast, California and the Upper Midwest (the two hardest-hit orders from make allowance increases) had only modest Class I differential gains of $6 million–$8 million, underscoring the uneven benefits across regions.
Beyond these pool-level impacts, producer location differentials add another layer of complexity. While the uniform price reflects a weighted average across all classes, USDA’s changes altered the relative adjustments applied to where milk is actually delivered. In some cases, this shifted location adjustments from positive to negative, erasing historical advantages for certain regions. As a result, even in orders where pool values rose, some farmers may still face comparative, and in some cases absolute, losses in their milk checks, a dynamic not captured in the simple pool revenue math above.
Other Changes
One change that complicates impact analysis is the removal of 500-lb barrel cheese from USDA’s National Dairy Product Sales Report. Since June, USDA has only published sales volumes and prices for 40-lb blocks, which now serve as the sole value in FMMO protein price formulas. Because USDA no longer reports barrel prices, pool impacts cannot be calculated in the same way as for other amendments. However, CME spot data continues to show barrels trading at or below block prices (consistent with hearing testimony), suggesting that the removal of barrels has provided a modest lift to Class III prices. This is particularly beneficial for orders with high manufacturing utilization, such as the Upper Midwest.
The final amendment, updated composition factors, will take effect Dec. 1. Composition factors represent the assumed levels of butterfat, protein and other solids in milk. Over time, advances in breeding and nutrition have naturally increased these levels, meaning farmers have been delivering milk richer in solids than USDA formulas recognize. Updating the factors better aligns pay prices with the actual components in the milk supply. Estimates suggest this change could add $200 million annually to pool value. But with implementation delayed six months, farmers have effectively lost about $100 million in compensation, a costly missed opportunity, especially since make allowance increases were implemented immediately.
Conclusion
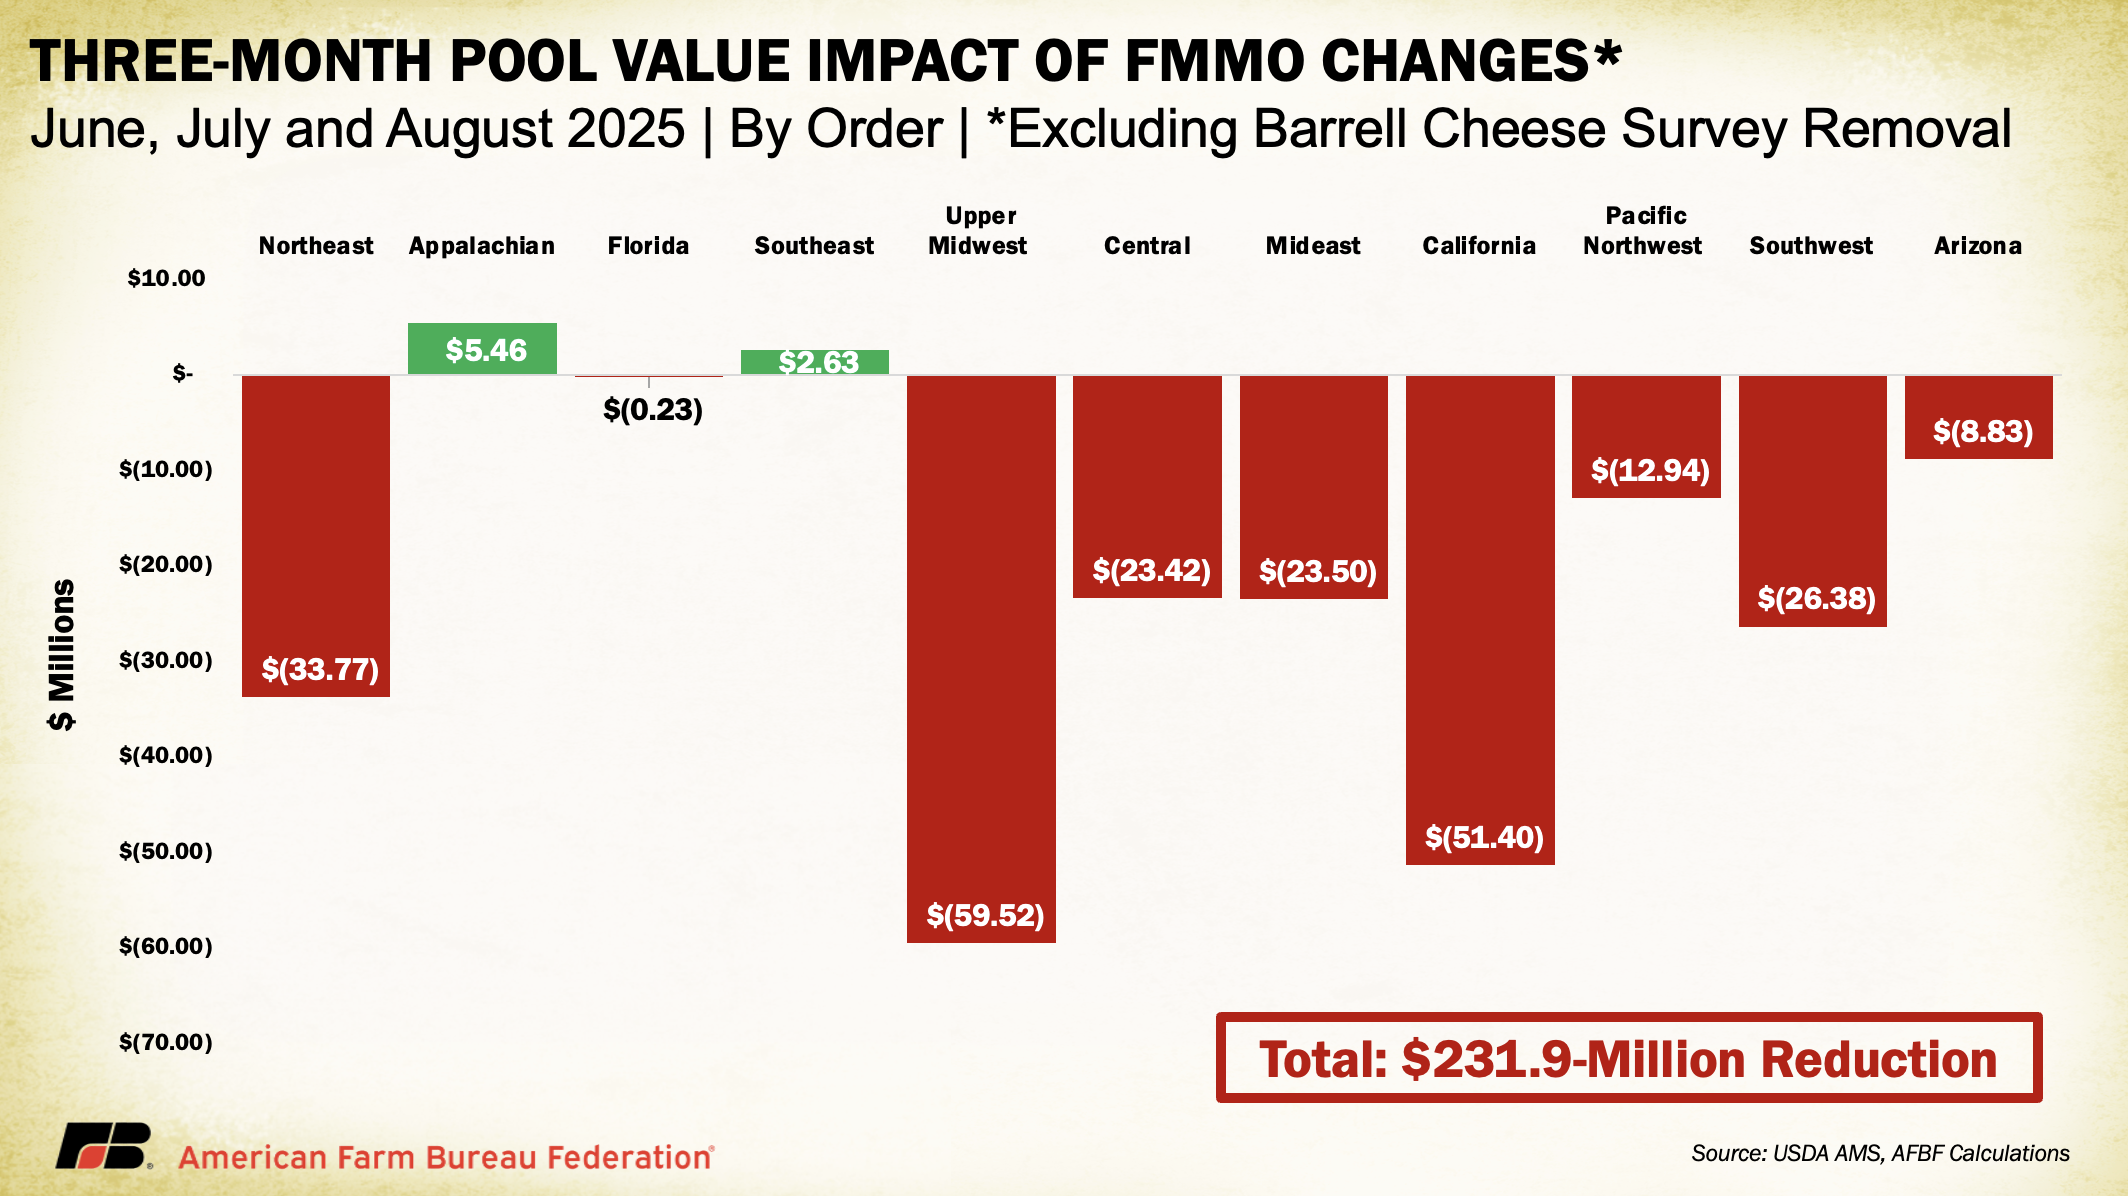
Three months into implementation, the early impacts of USDA’s FMMO amendments are becoming clearer. Higher make allowances have imposed the most significant cost to dairy farmers, cutting $337 million from pool revenues and lowering class prices across the board. Gains from higher Class I differentials and the removal of barrel cheese, along with the eventual boost from updated composition factors, help offset some of those losses but do not eliminate the uneven and often regionally lopsided effects. The return to the higher-of Class I mover provides farmers with stronger protection during volatile markets, though in calmer periods its advantages can be less visible. Taken together, the shifts in make allowances, the higher-of Class I mover and updated Class I differentials produced a $231.9 million decline in pool revenues over the first three months, with outcomes diverging sharply between orders.
These results highlight both the strengths and weaknesses of the FMMO system. The FMMO system continues to provide stability in milk marketing, but its reliance on limited data and the contrast between delayed implementation of composition factor updates and immediate rollout of processor-favored make allowance hikes highlight the ongoing imbalance in how risk and reward are shared. The mandated biennial cost survey from the One Big Beautiful Bill Act offers hope for a more transparent and accurate foundation for future amendments, but until then, farmers remain exposed to a pricing system built on incomplete cost data, leaving milk checks vulnerable to assumptions that may not reflect the true expenses borne by processors.

Top Issues
VIEW ALL