Tracking Ag Trade: July Changes
TOPICS
Trade
photo credit: Getty
Veronica Nigh
Former AFBF Senior Economist
USDA’s import and export trade data for July 2020, released last week, provides important insight into the continuing impact of the COVID-19 outbreak on U.S. agricultural trade.
July 2020 marked the fifth consecutive month and the sixth month in 2020 that the U.S. had a negative ag trade balance. The negative balance of $596 million for July brings the total negative trade balance for the first seven months of 2020 to $3.551 billion. As we see in Figure 1, this balance is down sharply from January-June 2019, when the balance was negative $38 million. Going back further, January-June 2020 net ag exports are down significantly from 2016-2018. The trade balance for the first seven months for 2016, 2017 and 2018 was $3.719 billion, $7.173 billion and $5.784 billion, respectively. 2017 is an important benchmark, as it is largely regarded as the last “normal” year in agricultural trade, before the U.S. and various trade partners, including China, began exchanging retaliatory tariffs.
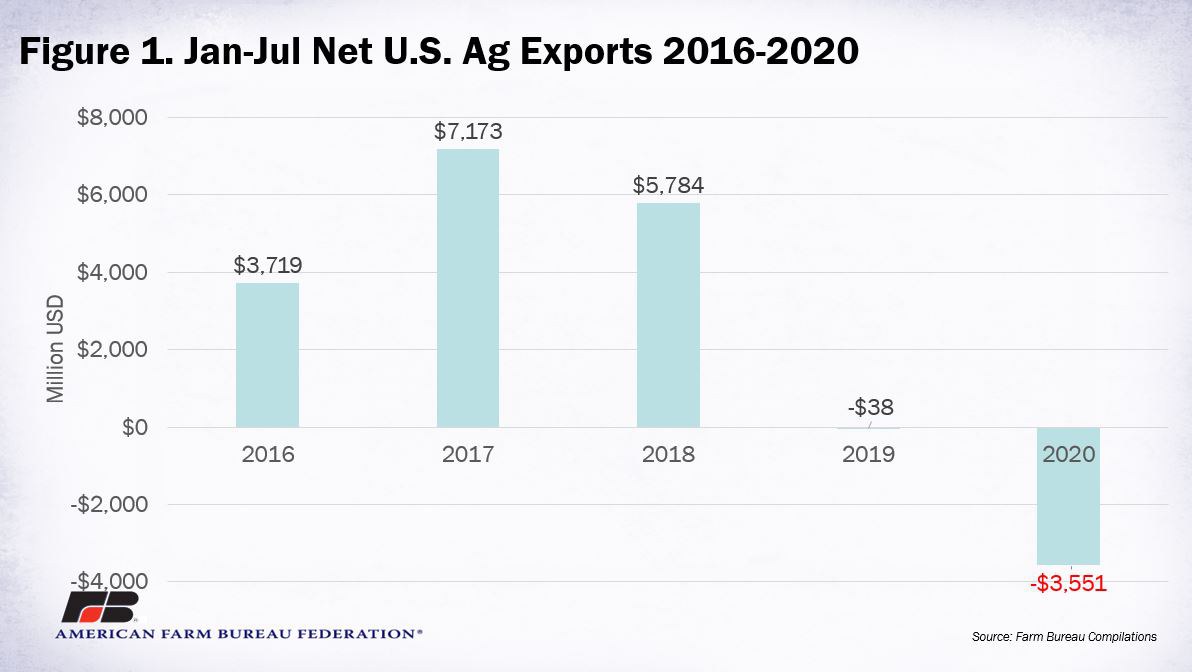
Figure 2 demonstrates that the decline in net trade of agricultural goods is not the result of any single event in any one region. For example, a decline in exports is evident in 11 of the 14 identified global trade regions. The largest decline was in North America, with $894 million less in exports during January-July 2020 than during the same period of 2019. Similarly, an increase in imports is evident in nine of the same 14 regions. Again, the largest change, was in North America, with $784 million more in imports during January-July 2020 than during the same period of 2019.
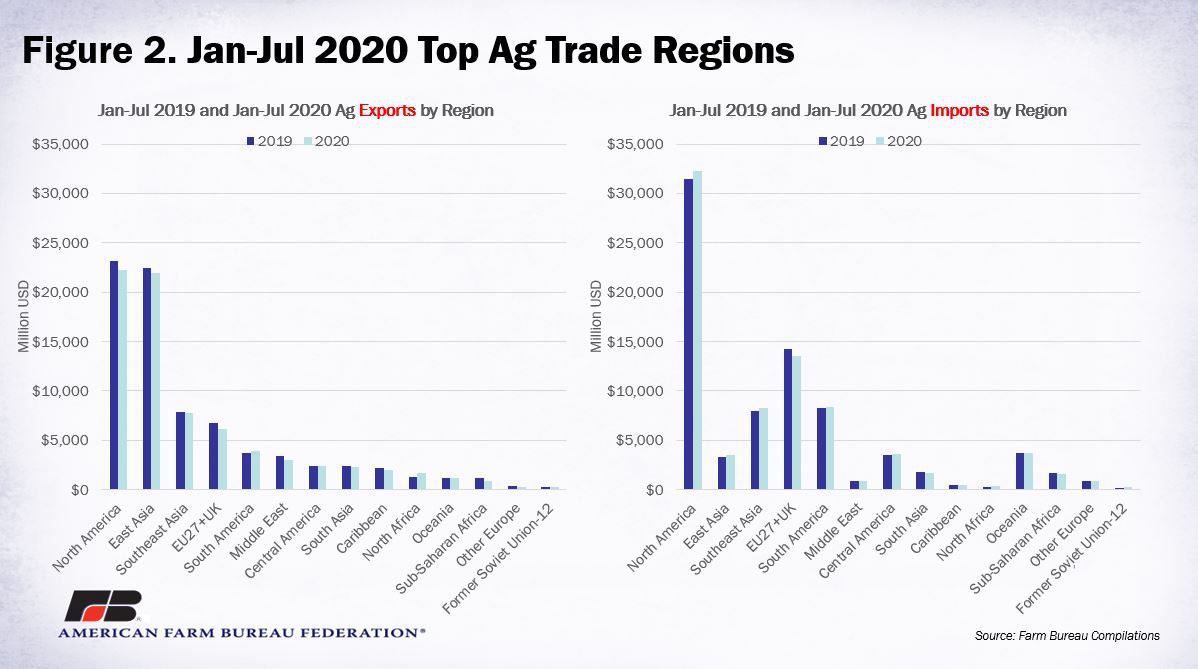
The combination of lower exports and increased imports created a negative trade balance in January-July 2020 in eight of the 14 identified regions. Given that North America had the largest increase in imports and the largest decline in exports, it is no surprise that it is the region with the largest decline in the trade balance. The negative trade balance with North America in January-July 2019 was $8.3 billion, but that number climbed north of $10 billion during the same months of 2020.
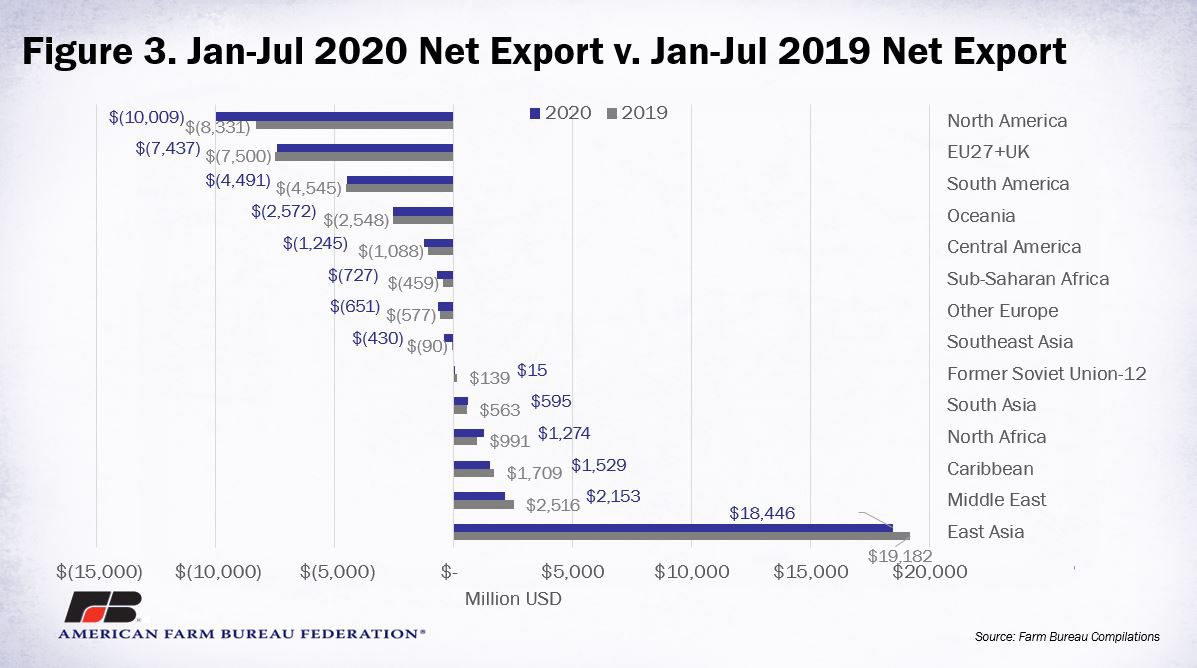
However, the news is not all bad. U.S. agriculture maintained a positive trade balance in six of the 14 identified regions. However, as seen in Figure 3, even in regions with a positive trade balance in 2020, it is smaller than it was in 2019. For example, while the U.S. maintains a large positive trade balance with the East Asia region, at $18.446 billion, the trade balance in January-July 2020 was $736 million less than the $19.182 billion balance with that region in January-July 2019. The downward pressure on the trade balance is due to a mix of factors including retaliatory tariffs on U.S. ag products, weakened global demand due to the coronavirus and a relatively weak U.S. dollar, which tends to support strong volumes of exports, but at lower per-unit prices.
A dig into the data highlights which product areas posted the largest changes in the first seven months of 2020, compared to the same months in 2017 and 2019. Figure 4 does not include all product categories, but those that represent a significant share of both U.S. agricultural exports and imports. In it, we see that grains and feeds, oilseeds and cotton continue to have the largest positive trade surpluses in 2020. While still significantly positive, it is worth noting that the positive trade balances for both oilseeds and cotton are lower than during the same time period in 2017 and 2019. The positive trade balance for grains and feeds is up slightly ($50 million) from 2019, but down over $2 billion from the same time period in 2017.
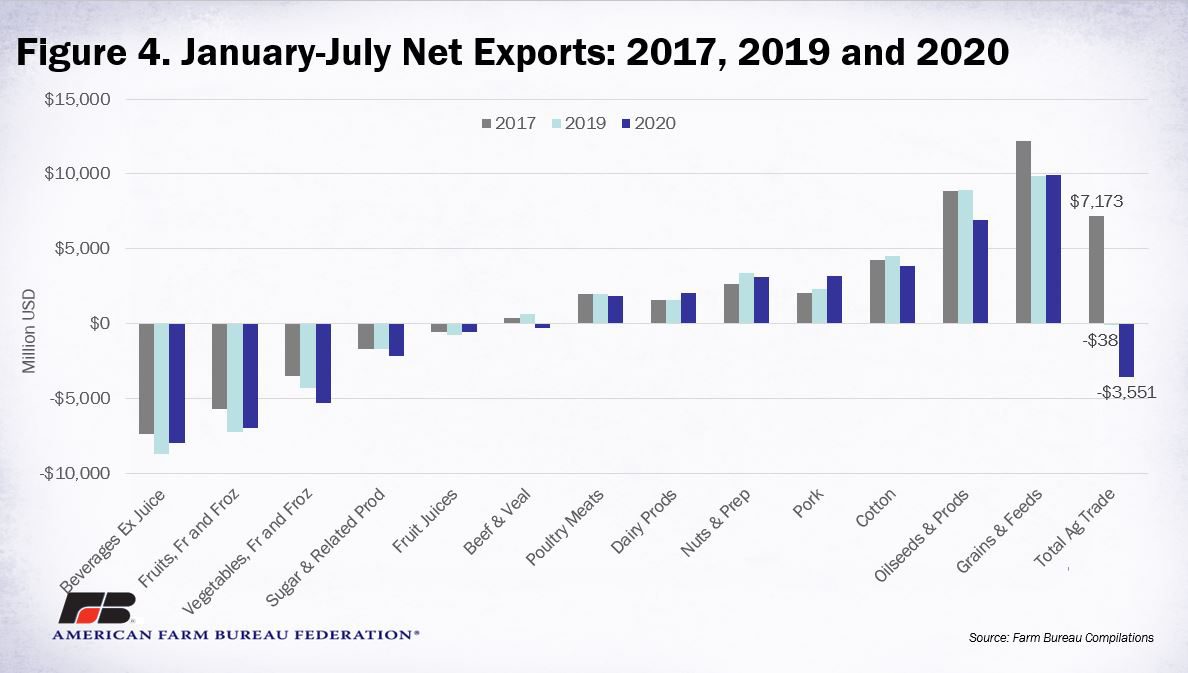
Pork continues to have the most sizable increase in net exports over the period. The January-July 2020 net positive trade balance of $3.2 billion is $875 million larger than the same time period in 2019 and over $1 billion higher than the same period in 2017. This is driven by an incredible increase in exports, largely to China, as a result of the African Swine Fever outbreak there, which decimated the local pork supply. It is likely that Germany’s announcement yesterday that a dead wild boar with ASF had been found near its border with Poland will threaten that country’s pork exports to China. Prior to this, Germany was regularly the second- or third-largest exporter of pork to China. If China imposes an import ban on German pork, there will be potential for significant additional exports of U.S. pork to China.
At the other end of the chart are the product areas with the largest negative positions in net exports. Here we see that beverages, fruits and vegetables, which have had a negative trade balance for several years, continue to add significantly to the 2020 calendar year negative trade balance. In beverages, the January-July 2020 negative trade balance of nearly $8 billion is an improvement from the same time period in 2019, when the negative trade balance was $8.7 billion. This is largely due to significant declines in imports of wine and malt beverages from partners like the European Union, which is facing additional retaliatory tariffs in the U.S. market.
China
While China is part of the East Asia region described above, it is worth mentioning China separately. All eyes have been on China since the implementation of the Phase 1 deal in February 2020. As a reminder, the Phase 1 deal commits China to importing around $36.5 billion in agricultural goods in calendar year 2020. We generally discuss export value, rather than import value and the distinction is important because export values and import values rarely match. The reason is that import value is based on the cost of the goods plus the cost of insurance, shipping and freight from the export port to the import port. The export value only includes the cost of the goods and the costs of shipping and handling to get the product from its origin to the export port. This means that the costs of shipping, insurance and freight need to be removed from the $36.5 billion import value to reach an export value. For several months, we have assumed shipping, insurance and freight account, on average, for 15% of the total cost. Reducing the $36.5 billion by 15% leaves an export value of approximately $31 billion.
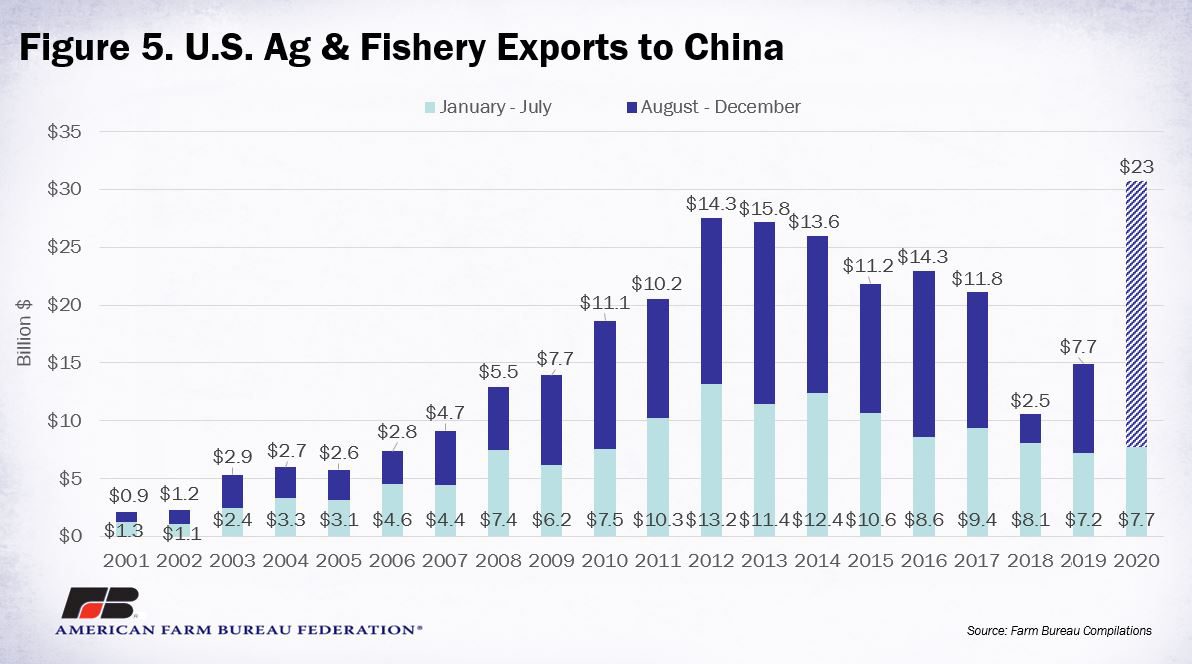
With that understanding, January-July 2020 agricultural and fishery exports to China were $7.7 billion. This is an increase from the same months in 2019, when exports were $7.2 billion, but down from January-July 2017, when exports were $9.4 billion. As seen in Figure 5, in order to reach the $31 billion export target for 2020, August-December agricultural and fishery exports to China need to reach approximately $23 billion. This would be nearly twice the level of exports experienced during the same months of 2017.
Conclusion
Recent trade data continues to highlight that the challenges producers are facing go beyond production. For an industry accustomed to achieving a trade surplus year after year, a trade deficit of nearly $3.551 billion over the first seven months of 2020 is noteworthy. Though consistent with historical patterns, the last several months of the calendar year will need to produce significant exports to push net U.S. ag trade back into a positive position.
Top Issues
VIEW ALL