U.S. Apples and NAFTA

photo credit: North Carolina Farm Bureau, Used with Permission
Veronica Nigh
Former AFBF Senior Economist
Implications
Usually, when the success of trade agreements is discussed, the measure of success is the value and volume of exports. Often, imports are not discussed, and when they are it is in a rather negative manner. Certainly, imports can have negative impacts on domestic production; in a few weeks, we will discuss some segments of U.S. agriculture for which this is true. In many other circumstances, however, imports can complement domestic production, allowing farmers in both the United States and exporting countries to grow simultaneously. In many ways, that is the story of the apple industry under NAFTA.
The Story
U.S. apple production has remained fairly constant over the last 20 years – generally somewhere in the 4-4.5 million metric ton range. Over that time period, domestic consumption of apples, both fresh and processed, has also remained fairly constant. The interesting element is that the share of production exported has increased from 10 percent in 1993 to 17 percent in 2016, with a few years since 2010 where that share exceeded 20 percent. In value terms, apple exports have grown from $300 million to $921 million over the period. Meanwhile, the import share of domestic consumption has grown nominally from 3 percent to 4 percent, with a few years where the share reached 5 or 6 percent. The value of these imports has grown from $86 million to $300 million. Figure 1 highlights this activity.
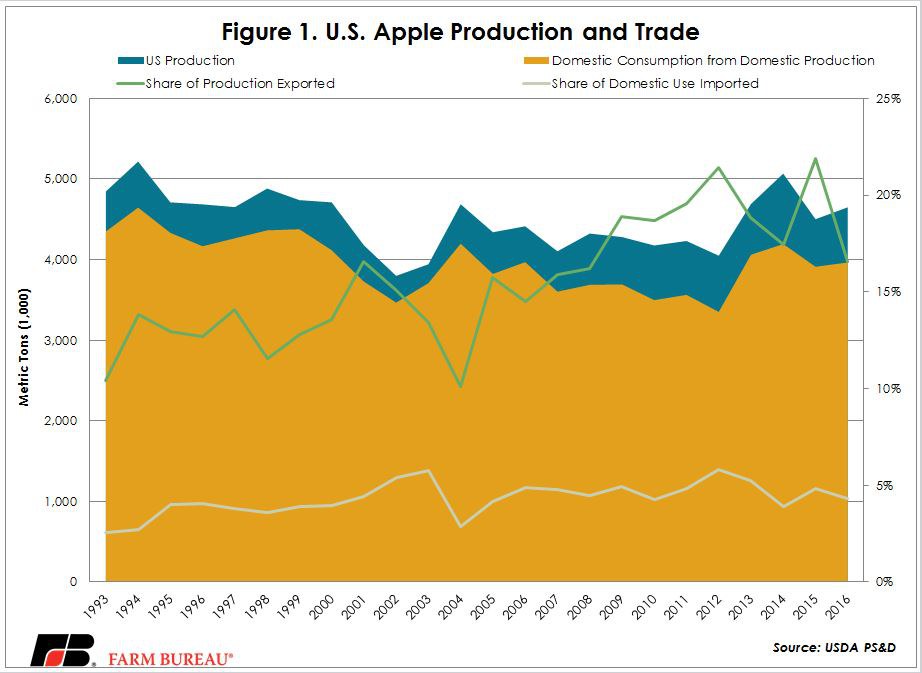
What is clear from figure 1 is that the U.S. produces enough apples for domestic consumption, so why bother trading apples across borders? The answer lies in seasonality, varieties and consumer preference.
NAFTA Apple Trade
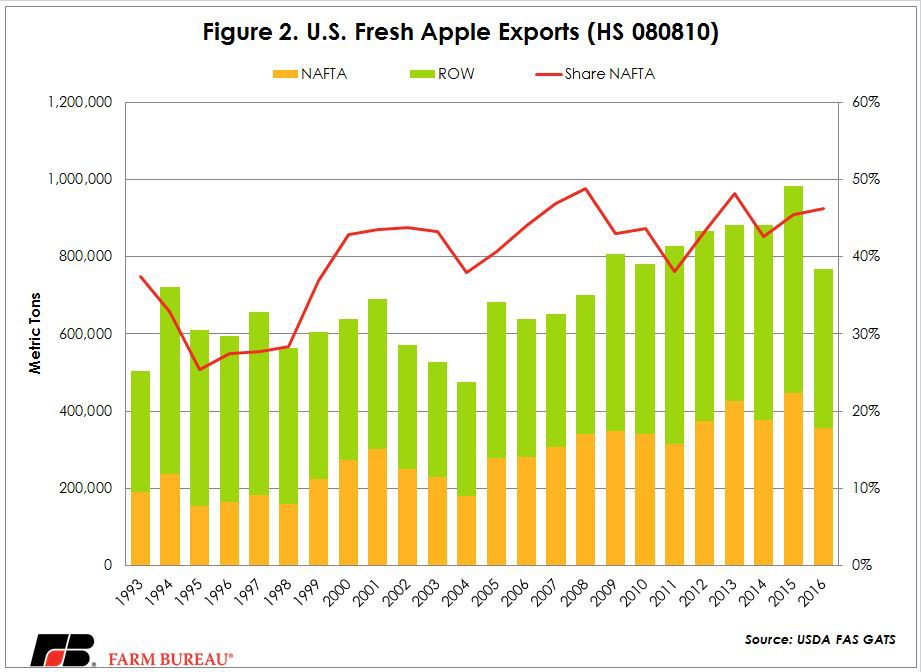
Trade in apples between NAFTA partners has increased significantly since implementation of the agreement. U.S. apple exports to Canada and Mexico have grown from slightly less than 200,000 MT in 1993 to about 350,000 MT in 2016. U.S. apple export dependence on NAFTA partners has also grown, from 37 percent to 46 percent, as demonstrated in figure 2. Of those NAFTA exports, in 2016, 60 percent went to Mexico and 40 percent went to Canada.
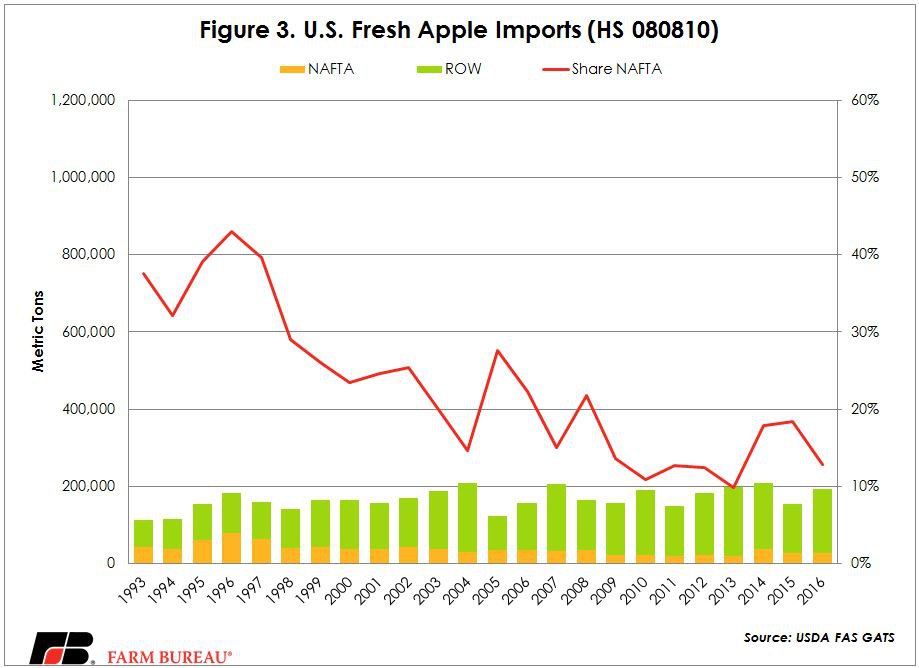
U.S. apple imports from NAFTA partners come almost exclusively from Canada. In every year except 2016, Mexico exported zero MT of apples to the U.S. In 2016, Mexico exported about 1,200 MT of apples to the U.S. – about 1 percent of total apple imports. Interestingly, the share of all apple imports into the United States from NAFTA partners has fallen significantly over the course of the agreement. In 1993, the year before NAFTA came into force, 38 percent of U.S. apples were from Canada. By 2016 that share was only 13 percent, as shown in figure 3.
Getting back to the question above - why bother trading apples across NAFTA borders? We turn to USDA FAS GAIN reports for more information.
Canada
According to the USDA FAS GAIN report 2016 Fresh Deciduous Fruit Annual – Canada, the Canadian apple industry has undergone some significant changes over the last 15 years. “More affordable imports from the United States, Chile and other low-cost countries, combined with high production costs and a strong Canadian dollar forced the apple industry to downsize. However, data for the recent years seem to indicate that the sector has now stabilized, as growers have learned what production level is most economical and profitable.
“Growers that intend to remain in the industry are turning to newer, more popular varieties such as Ambrosia and Honeycrisp and new, modern intensive planting systems in an attempt to remain competitive with imports. Market analysts note a consumption trend away from some of the more traditional varieties, while the Ontario Apple Growers Association reported that ‘one in every three apples eaten in Ontario is a Gala, most likely grown in Washington state or Chile.’”
The major apple-producing regions, in order of production, are Quebec, British Columbia, Nova Scotia, Ontario and New Brunswick. According to the Canadian Horticulture Council, the introduction of new varieties has been particularly important: growers have been planting new varieties like Cortland, Spartan, Empire, Spy, Gala, Idared, Fuji, Braeburn, Jonagold, Honeycrisp, Paula Red and Ambrosia.
Since 2000, Canadian total imports of fresh apples increased by nearly 75 percent, while imports from the United States almost doubled. Overall, imports account for 33-40 percent of total supply in most years. The U.S. has a market share of around 80 percent. The second largest supplier of apples is Chile, which has a strategy focused on developing export markets.
Mexico
Imports account for 20-40 percent of total supply in Mexico, depending on the volume of domestic production. Production in Mexico is dominated by two varieties, Golden Delicious (43 percent) and Red Delicious (34 percent). According to USDA FAS GAIN report 2016 Fresh Deciduous Fruit Annual – Mexico, the state of Chihuahua accounts for 47 percent of the total area planted in Mexico, where farmers generally use more advanced production technology than in other states, resulting in higher-quality apples.
According to the same report, four varieties continue to dominate the Mexican market, and account for 98 percent of the imported volume to date: 39 percent Red Delicious, 30 percent Gala, 22 percent Golden Delicious and 7 percent Granny Smith. Apples from other countries like Chile, New Zealand, China and Canada will compete with U.S. apples into the future.
The United States
The United States produces more than six times as many apples as Mexico and 12 times as many apples as Canada. According to the U.S. Apple Association, the top 10 varieties produced in the U.S. are Red Delicious, Gala, Granny Smith, Fuji, Golden Delicious, Honeycrisp, McIntosh, Rome, Cripps Pink/Pink Lady® and Empire. The top 10 apple varieties sold in the U.S. are Gala, Red Delicious, Fuji, Granny Smith, Honeycrisp, Golden Delicious, McIntosh, Cripp’s Pink/Pink Lady®, Braeburn and Jazz®.
The rank order of listing of U.S. production vs. sales is provided to highlight while the U.S. is far and away the largest producer of apples among the NAFTA partners, the preferences of growers and consumers aren’t in total lock step. The top apple produced is Red Delicious, while it is only the second largest variety by sales. Meanwhile, the Red Delicious is the top apple consumed in Mexico. Braeburn apples are the ninth most popular apple consumed in the United States but don’t make the top 10 production list. However, Braeburn apples are widely produced in Canada. Trade allows us to better match production and consumption.
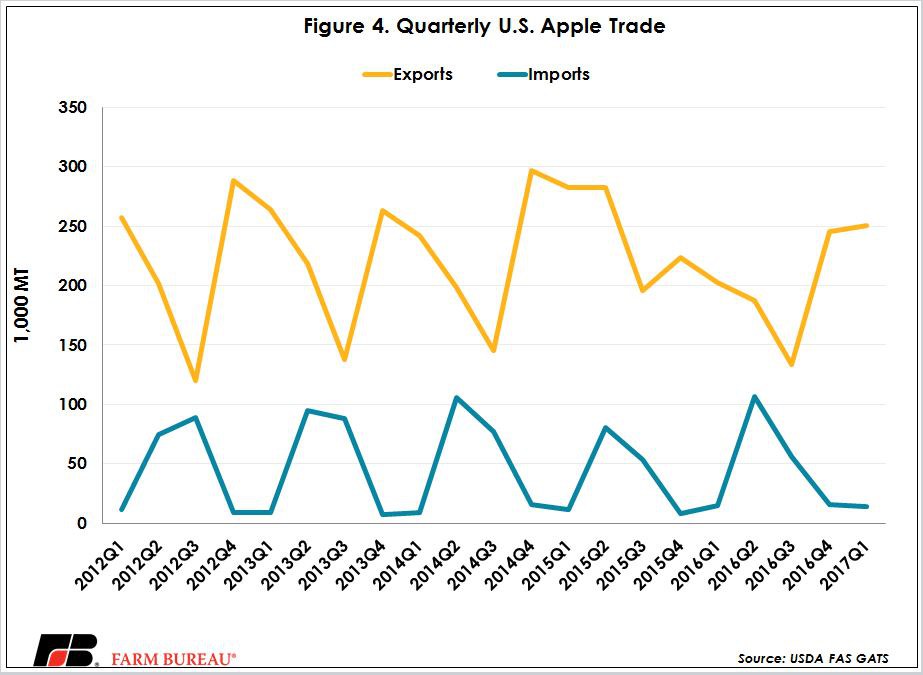
Trade also facilitates the supply of fresh apples year round. Figure 4 highlights that there are significant swings in U.S. imports and exports of apples that follow the production season. It is no coincidence that exports are at their highest point, while imports are at their lowest.
Top Issues
VIEW ALL