U.S. Rice and NAFTA

photo credit: Getty
Veronica Nigh
Former AFBF Senior Economist
Implications
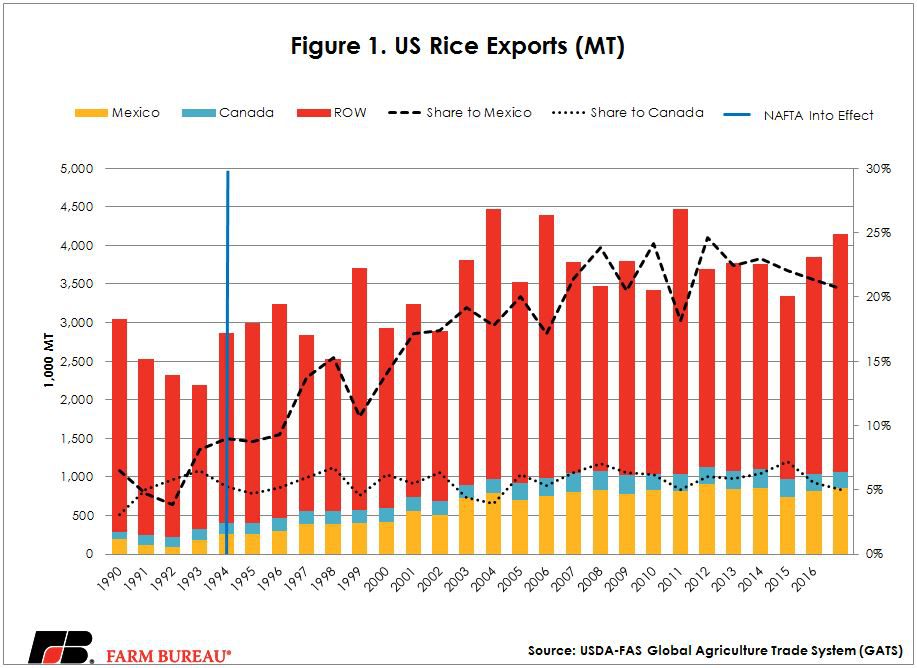
The NAFTA agreement series begins our focus on commodities, with a look at rice. In 2016, one in every eight rows of rice planted in the United States made its way to our NAFTA partners. But recent moves by the governments of the United States, Mexico and Canada could lead to a change in the important Mexican and Canadian markets.
The Growth Story
Prior to the NAFTA agreement, U.S. rice into Mexico faced bound (maximum allowable) tariffs of 9 percent on paddy rice and tariffs of 45 percent on husked, milled and broken rice. Under NAFTA, trade in all goods between the United States and Mexico became duty-free on January 1, 2008. As a result of an advantaged tariff situation, strong marketing efforts and a high-quality product, Mexico is now the single largest market for U.S. rice. In 1993, the year before NAFTA went into effect, 9 percent of U.S. rice exports went to Mexico. By 2016, that share had grown to 21 percent.
Prior to the Canada-U.S. Free Trade Agreement which was brought into force on January 1, 1989, and superseded by NAFTA, the U.S. faced tariffs on rice into Canada as well, though minimal. Canada’s bound tariffs on milled and broken rice were $3.53 per ton, while paddy and husked rice entered duty-free. Again, as a result of NAFTA, those rates were reduced to zero. Canada remains a fairly small market for U.S. rice, accounting for about 5 percent of all rice exports.
Competition Lies in Wait
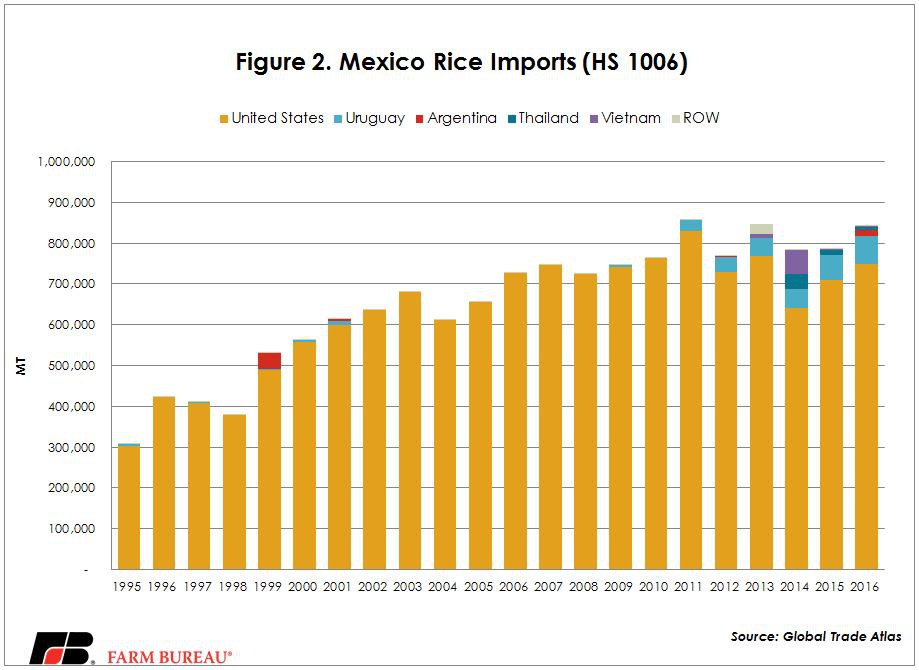
Clearly, U.S. rice has a strong foothold in the Mexico market, but we must always remember that there are other exporters in the world ready to capture our markets if we falter. Currently, our competitors who do not have an FTA with Mexico still face significant applied tariff rates - 9 percent on paddy rice and 20 percent on husked, milled and broken rice. However, the Government of Mexico (GOM) has been experimenting with providing additional market access for non-FTA partners. For example, Vietnam received duty-free access to the Mexico market from 2008 through December 2014. Figure 2 highlights the impact of that additional access, especially in 2014. More recently, the GOM officially announced permits of up to 150,000 MT of rice (all types) originating from non-free trade agreement countries, opening the door for Vietnamese milled rice to enter Mexico duty-free. Figure 2 highlights the cracking of the door to the Mexico rice market that we’ve seen the last few years.
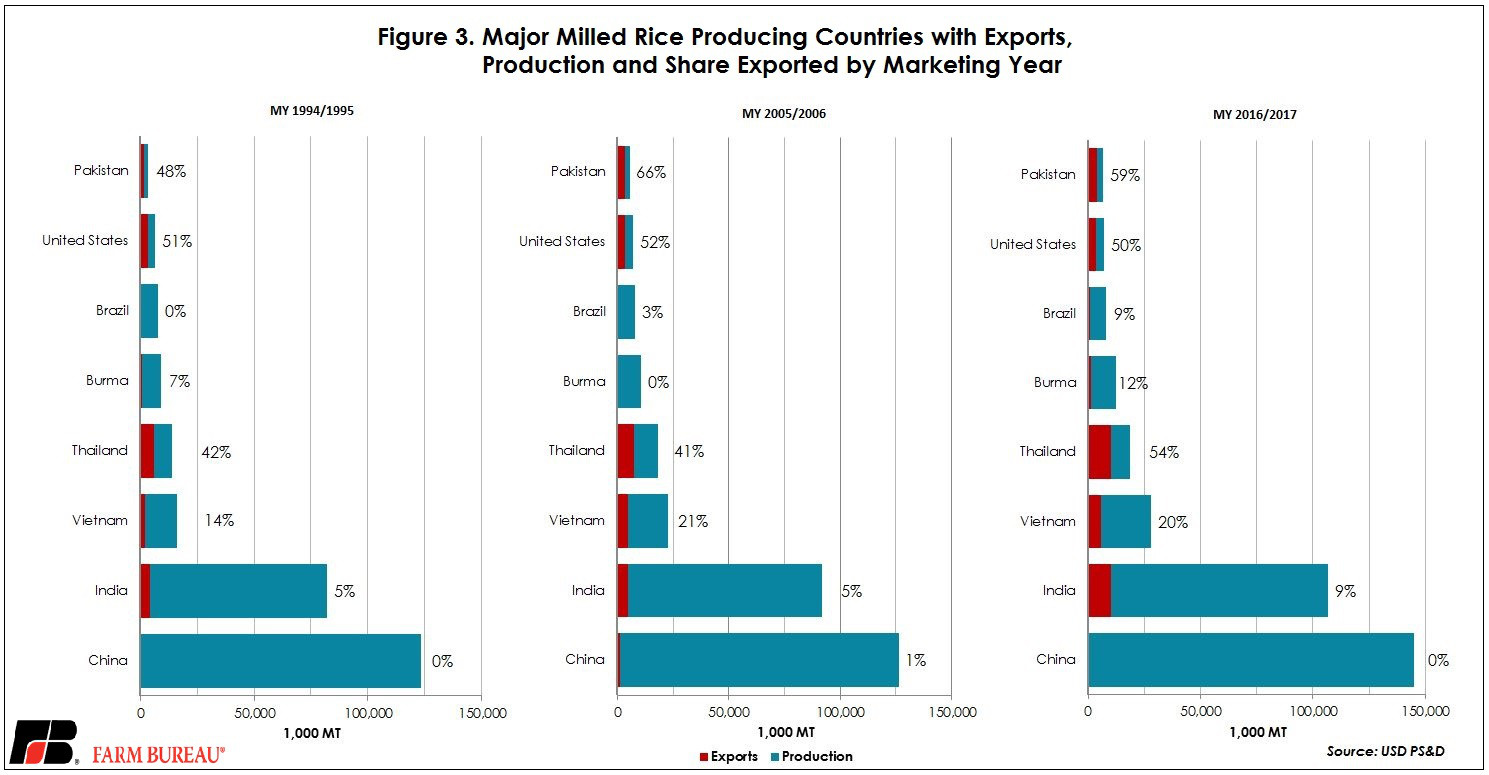
The U.S. is a fierce competitor; USDA projects that in the 2016/2017 marketing year the U.S. will be the fifth largest exporter of milled rice globally, yet only the 13th largest producer. But, the obvious question is whether other countries have the production capacity and export experience necessary to rival the U.S. in these important markets if the U.S. falters. Figure 3, drawn from USDA’s Production, Supply and Distribution data, highlights that since 1994, several countries have both increased their production and export prowess. For example, between the 1994/95 and 2016/17 marketing years, Vietnam grew its production and exports of milled rice by 71 percent and 142 percent, respectively. The question of whether there are competitors with the capacity to take the Mexican market seems to have been answered.
Top Issues
VIEW ALL