Updated End-of-Year Farm Economic Outlook
TOPICS
Trade
photo credit: AFBF Photo, Mike Tomko
John Newton, Ph.D.
Chief Economist
The U.S. economy continues to outperform expectations. Year-over-year growth in gross domestic product has been positive for 36 consecutive quarters, unemployment is the lowest in nearly 50 years and inflation remains mostly flat (U.S. GDP Growth Continues Impressive Run). While the U.S. economy roars along, the farm economy continues to struggle. USDA’s most recent Farm Sector Income Forecast revealed that net farm income in 2018, a broad measure of farm profitability, is projected at $66.3 billion, down 12 percent from prior-year levels. After adjusting for inflation, net farm income in 2018 is projected to be at the third lowest-level in more than two decades.
A variety of factors influence net farm income. Lower commodity prices drive profitability down, but higher yields can somewhat offset the effect of lower commodity prices. Higher costs obviously reduce profitability. Today’s article reviews the end-of-year projections for cash receipts, expenses and net farm income in 2018.
Cash Receipts Flat in 2018
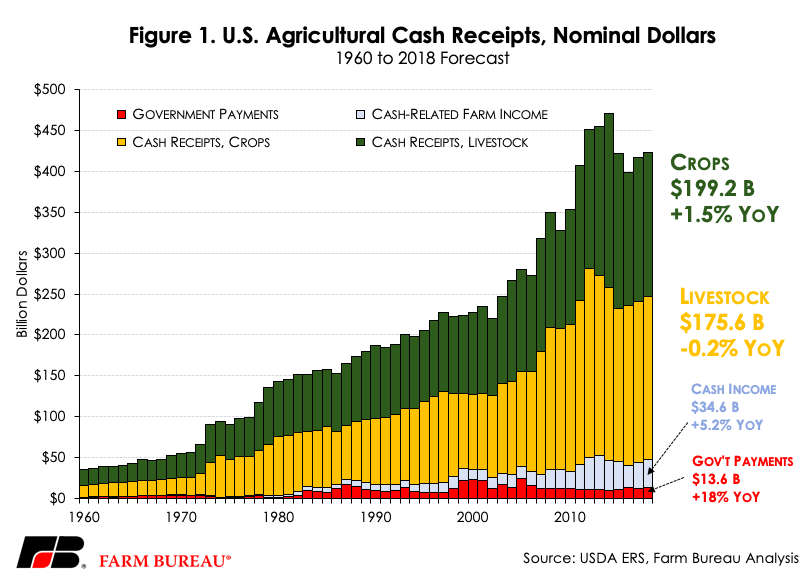
Driven by higher cash-related farm income, ad hoc disaster assistance and trade-based market facilitation program payments, as well as higher-than-anticipated crop yields and record production of many livestock-related products such as milk, pork and beef, gross agricultural cash receipts in 2018 are projected at $423 billion, up 1.5 percent, or $6.3 billion, from prior-year levels. If realized, this total would be $10 billion below the 10-year average and $47.5 billion below 2013’s record high. When adjusted for inflation, gross cash receipts are down 0.8 percent, $22 billion below the 10-year average and nearly $80 billion less than the record $501 billion in 2014.
A majority, or 47 percent, of gross cash receipts in 2018 come from crop production. Cash receipts for crops in 2018 are projected at $199.2 billion, up 1.5 percent, or nearly $3 billion, from 2017 and in line with the 10-year average. Nearly 42 percent of cash receipts are projected to come from livestock and livestock product production. Cash receipts in livestock are projected at $175.6 billion in 2018, down 0.2 percent, or $400 million, from 2017 levels. This is slightly higher than the 10-year average of $169.5 billion. When adjusted for inflation, however, cash receipts for both crops and livestock are down from prior-year levels at -0.8 percent and -2.5 percent, respectively.
Higher Expenses Lead to Lower Net Farm Income
Total agricultural-related expenses in 2018 are projected at $369.1 billion, up $14.8 billion, or 4.2 percent, from prior-year levels. If realized, total expenses in 2018 would be at the highest level since 2014. After adjusting for agricultural inventory and home-consumption of farm products, net farm income in 2018 is projected at $66.3 billion. This total is slightly higher than USDA’s February and August net farm income projection – reflecting updated expectations for commodity prices and production as well as the distributions of ad hoc disaster program payments.
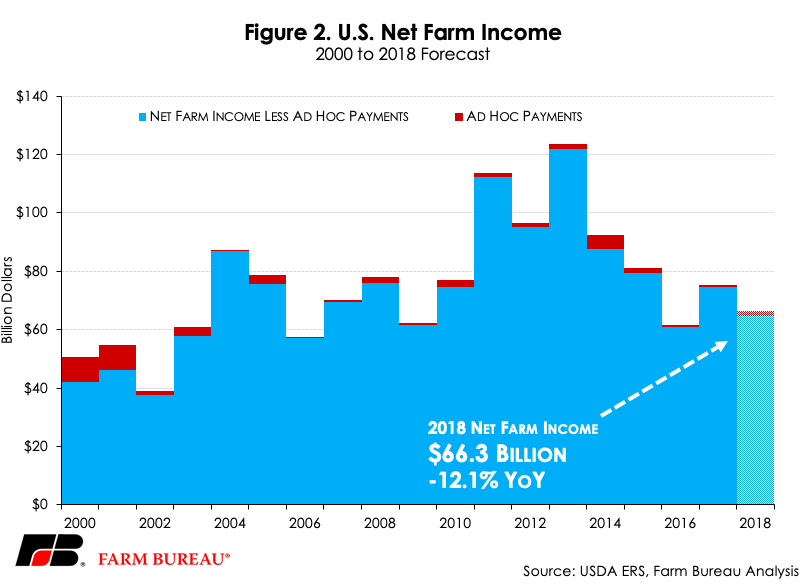
Net farm income in 2018 is projected to be 12.1 percent, or $9 billion, below 2017 levels. It remains nearly $20 billion below the 10-year average and $57.5 billion below the record high set in 2013 – a decline of 46 percent. After adjusting for inflation, net farm income in 2018 is projected to be down nearly $11 billion, or 14.1 percent, from 2017 levels. Inflation-adjusted net farm income in 2018 is at the third-lowest level over the last two decades – behind only 2002 and 2016.
Impact of Ad Hoc Disaster and Trade Aid Payments
One factor contributing to higher net farm income in 2018 (relative to earlier USDA projections) is the inclusion of ad hoc disaster and trade-related payments to farmers and ranchers. Previous Market Intel articles have reviewed the initial market facilitation program payments of $4.7 billion: Trade Aid Round One: A State Perspective and Trade Aid Round Two: A Per-Acre Perspective.
USDA projects ad hoc disaster payments in 2018 at $1.6 billion, up sharply from 2017’s $679 million. When excluding ad hoc disaster payments, net farm income in 2018 is projected at $64.7 billion, down $10 billion, or 13 percent, from prior-year levels, and the third lowest level over the last decade, behind 2009 and 2016, Figure 2.
Summary
The most recent farm income projections line up with earlier forecasts for a 12 percent drop in 2018. The decline in farm profitability reflects lower commodity cash receipts in some categories, i.e., soybeans and dairy, but also higher cash receipts in other categories such as corn or poultry.
The outlook going into 2019 remains uncertain. Planting intentions, supplies, domestic demand and prices are all unknown. Global supply and demand also remains uncertain. Several bright spots, however, are on the horizon. First, a farm bill is very likely in the coming weeks – providing much-needed risk management certainty to farmers and ranchers in the years to come. Second, by all accounts, trade relationships could be on the verge of normalizing as the administration seeks to restore and improve access in key export markets.
These two developments, combined with regulatory relief and tax reform, give U.S. farmers and ranchers the certainty and some of the tools they need to compete with growers around the world – and ultimately turn around U.S. farm profitability.