USDA Forecasts 23% Drop From 2022 Farm Income Levels

photo credit: AFBF Photo, Mike Tomko
Daniel Munch
Economist
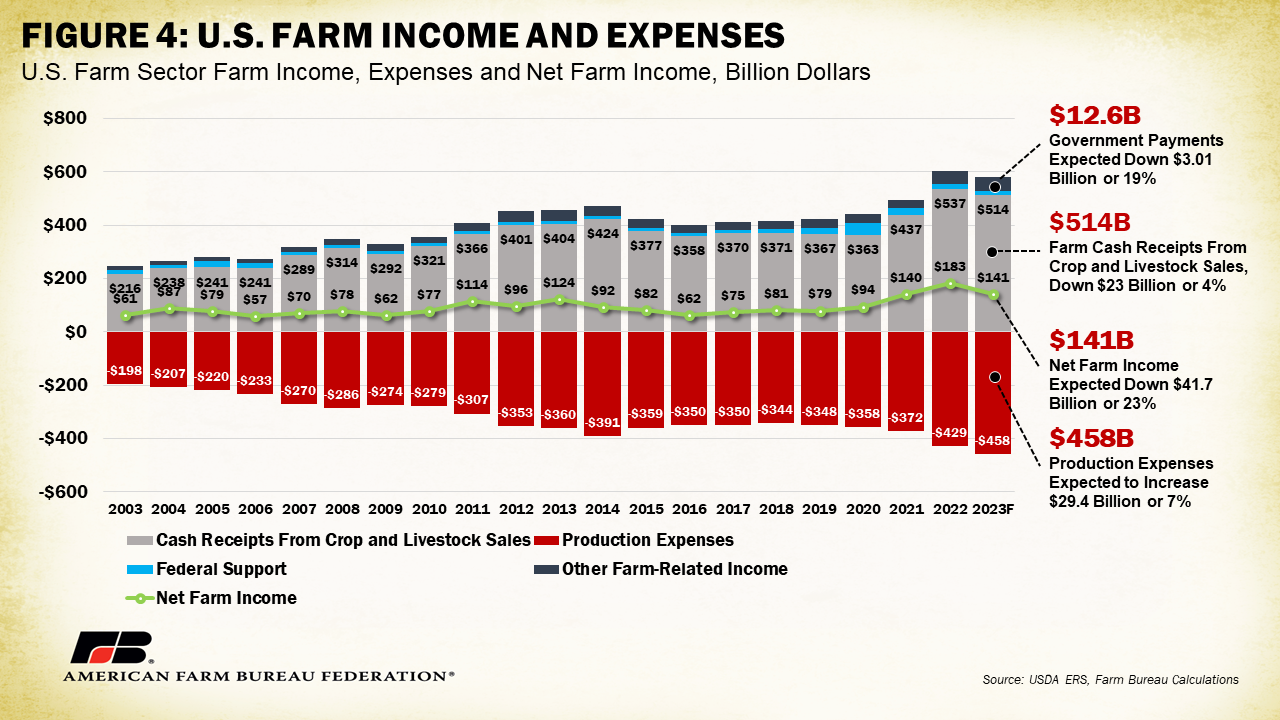
USDA’s most recent Farm Sector Income Forecast, released Aug. 31, dropped net farm income expectations for 2023 lower than initial February estimates to $141.3 billion, down 23% from 2022’s $183 billion. This $41.7 billion decline nearly erases the $42.9 billion increase that was forecast between 2021 and 2022 but is smaller than the $46 billion gain between 2020 and 2021 following the COVID-19 pandemic. When adjusted for inflation, net farm income, a broad measure of farm profitability, is expected to decrease $48 billion (25.4%) in 2023. The forecast also shows farm and ranch production expenses continuing to increase, rising by $29.5 billion (7%) in 2023 to $458 billion, following a record increase of $56 billion in 2022.
It is important to note USDA finalized net farm income for 2022, which has been forecasted until this release. In February, USDA had estimated 2022 net farm income at $162.7 billion, a 16% increase over 2021. This was adjusted to $183 billion, a 31% increase over 2021. USDA made upward revisions to cash receipts received in 2022 by over $6 billion and downward revisions to production expenses over $12 billion, explaining much of the difference.
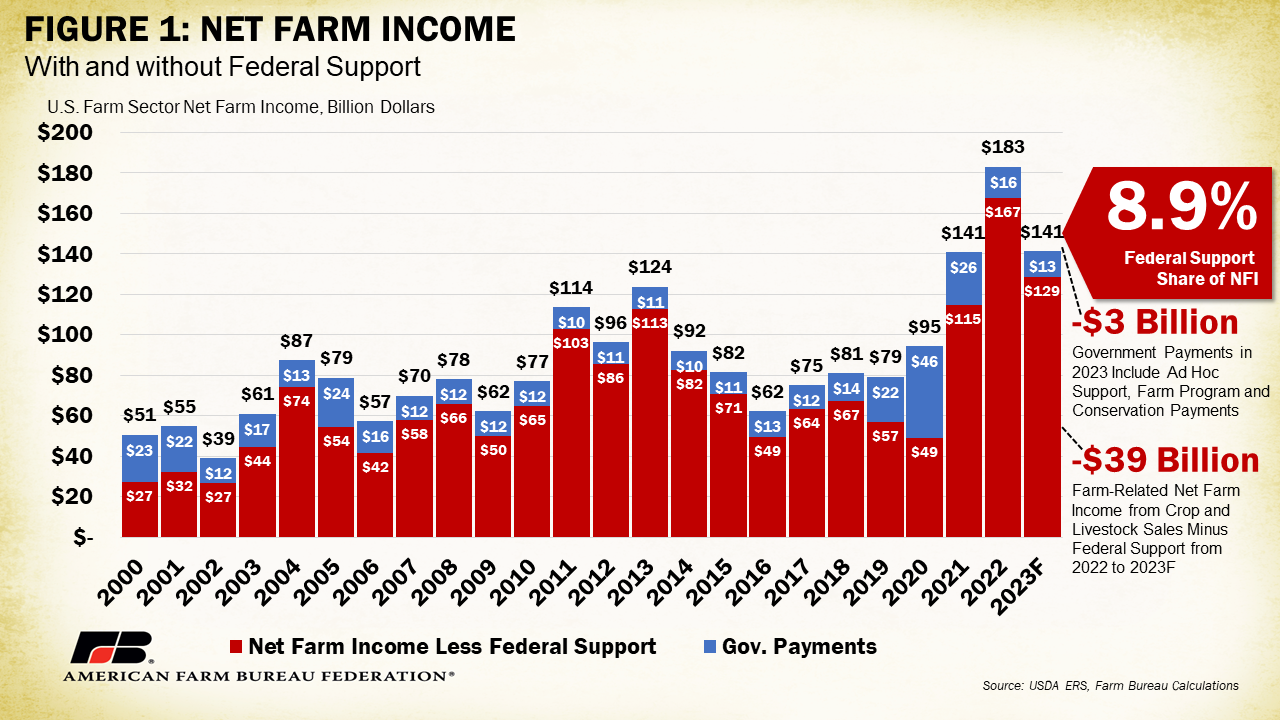
Direct government payments are estimated to decrease by $3 billion, or 19%, between 2022 and 2023 to $12.6 billion. This marks the third consecutive decrease in government payments for producers since the peak of the COVID-19 pandemic in 2020 but is higher than the $10.2 billion in payments forecasted in February. The decrease corresponds to near total reductions in both USDA pandemic assistance, which included payments from the Coronavirus Food Assistance Program and other pandemic assistance to producers, and non-USDA pandemic assistance programs, such as the Small Business Administration’s Paycheck Protection Program. Ad hoc and supplemental program payments, which include payments from the Emergency Relief Program (ERP), Quality Loss Adjustment Program and other farm bill designated-disaster programs, are expected to decrease from $11.3 billion to $7.4 billion, a 34% decline. Importantly, programs like ERP have not yet been extended for 2022 or 2023. If Congress authorizes more payments for disasters in these years, corresponding numbers are expected to increase dramatically.
Commodity insurance indemnities were adjusted down slightly for 2023 for an expected $21.85 billion. This a 9%, or $1.79 billion, increase over 2022’s $20.06 billion, marking the highest payout of indemnities since the data series began in 2005. This increase is likely the result of increased crop insurance enrollment by those who received a Wildfire and Hurricane Indemnity Program-Plus or ERP payment and are required to purchase crop insurance or Noninsured Crop Disaster Assistance Program coverage (when crop insurance is not available) for the next two available crop years.
Livestock
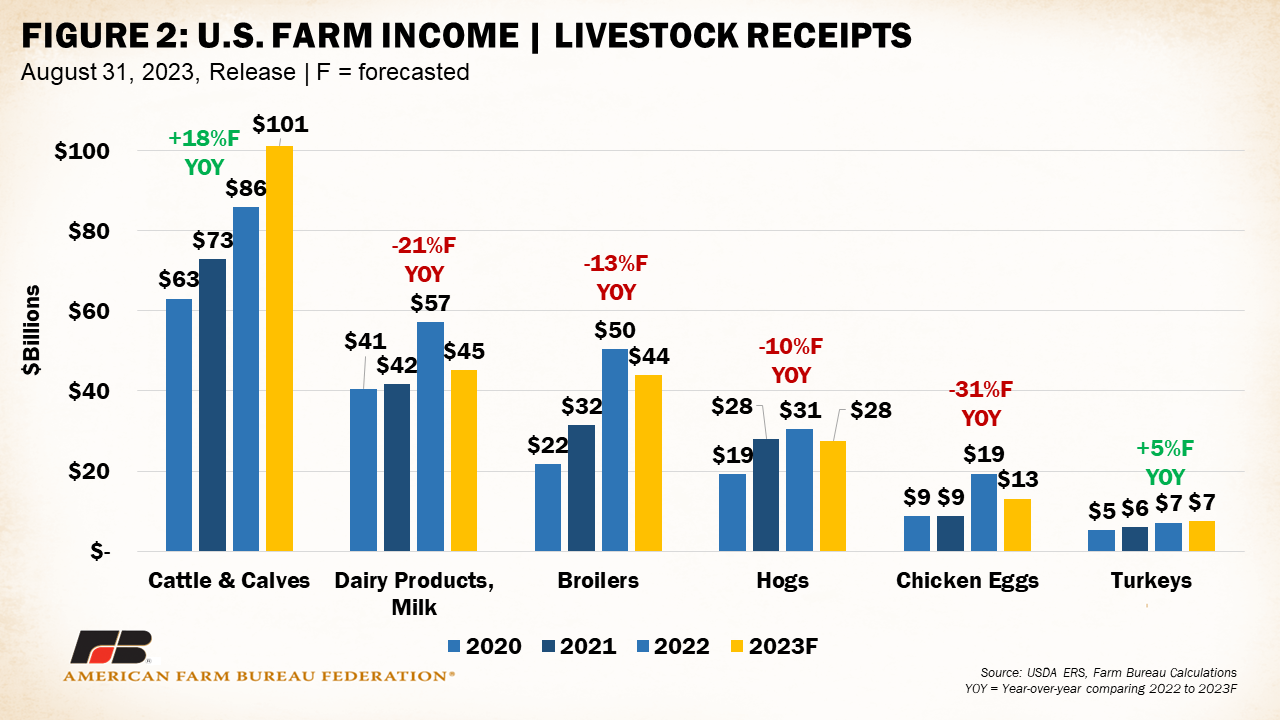
The largest decrease in net farm income is tied to a projected fall in cash receipts from livestock due to lower prices for all major categories except cattle and turkeys. The value of livestock production (in nominal dollars) is expected to decrease nearly 5%, or $11.9 billion, in 2023. This is a slightly smaller drop than forecasted in January when a 6%, or $14.7 billion, decline was estimated. Chicken eggs, broilers and milk are responsible for the largest percentage decreases, with cash receipts for chicken eggs projected to slip by $6.26 billion or 32%. Highly pathogenic avian influenza has affected nearly 59 million birds in commercial and backyard flocks in the U.S., including over 43 million egg layers, pressuring supplies and pushing up prices. As the flock continues to recover, egg production increases and consumer demand fundamentals recalibrate prices lower. A similar dynamic has resulted in a $6.52 billion, or 13%, drop in expected cash receipts for broilers. Milk receipts are expected to decline nearly $12 billion (21%) as milk prices have faltered throughout the year. June 2023 marked the first month that the Dairy Margin Coverage program’s “catastrophic” $4 margin level has been breached, illustrating the severity of price declines.
Cash receipts for cattle and calves are estimated to increase by $15 billion or 18%. As described in previous iterations, drought conditions in the West and southern Plains have damaged pastures and led to higher costs for feed such as hay. This has compelled many farmers to market heifers that would typically be kept for breeding and herd replacement, pressuring U.S. cattle inventory for years to come. Tighter cattle supplies have pulled both cash and futures prices higher, leading to continued growth in cash receipts. Notably, weather conditions continue to be a problem for cattle operations. Excessive heat in the Southwest and along the Gulf Coast has contributed to the direct deaths of livestock associated with heat exposure as well as forced liquidations and early calf weaning due to forage problems. These conditions only push cattle prices up further. It is worth noting that producers who have had to liquidate the bulk of their cattle or lose animals to weather conditions are not benefiting from higher receipts. Strong price conditions apply only to those who can supply the market.
Cash receipts for hogs are estimated to decline by 10% or $3 billion. It is important to note that hog farmers have experienced considerable losses in 2023. Losses for farrow-to-finish farms in Iowa were estimated to be $18.81 per head in June, the eighth consecutive month of losses in these operations. Lower hog prices have been the main cause for negative returns but prices have recovered and provided farmers with better profitability in July.
Crops
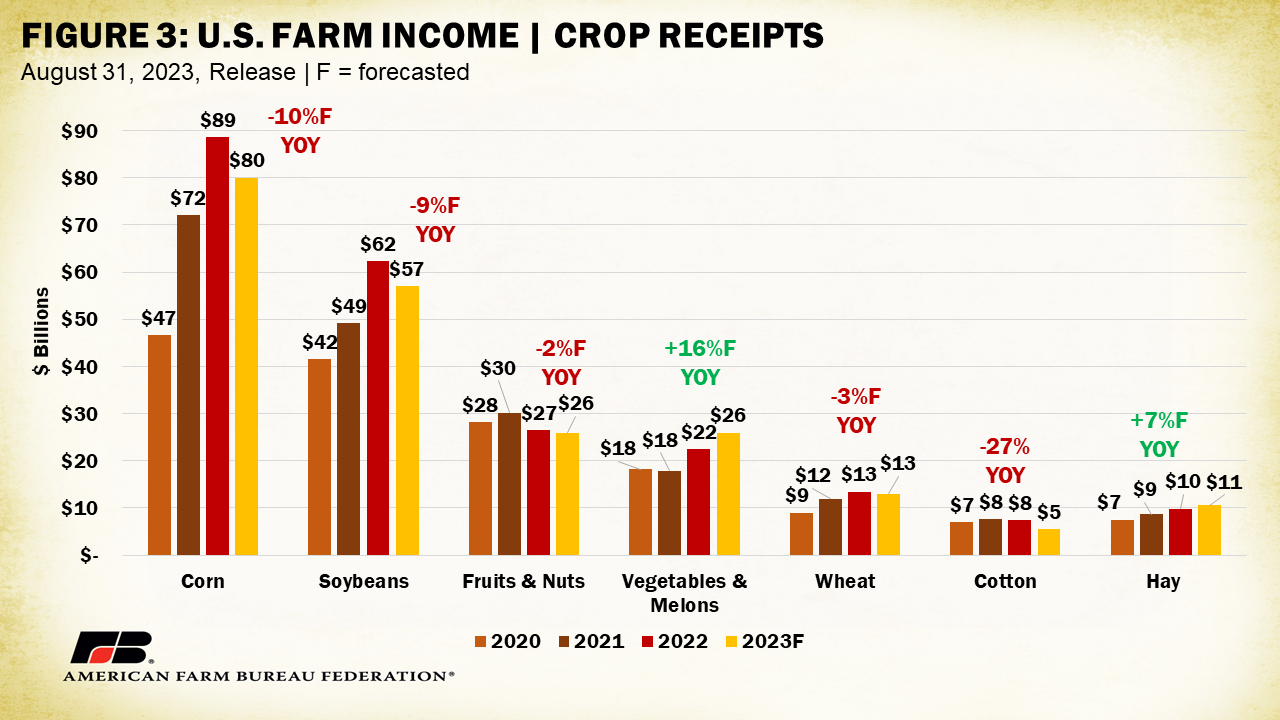
On the crops side, receipts for major row crops like corn, soybeans, cotton and wheat are expected to decline while receipts for vegetables, melons and hay are expected to increase. Receipts for corn are expected to fall by 10% ($8.4 billion), while soybeans are expected to be down 8.6% ($5.4 billion). Both commodities have faced declining prices since their peaks in 2022. Cotton receipts are expected to fall 27% from $7.5 billion to $5.4 billion. This is on top of high abandonment rates and low yields that have not yet been reflected in higher prices. Wheat is expected to be down $420 million to just over $13 billion. Fruits and nuts are expected to hover close to $26 billion in receipts, while vegetables and melons are poised to rise from $22.4 billion to $25.9 billion (+27%). Improved drought conditions in Western states like California, Oregon and Washington may be linked to better volume dynamics to produce and sell product. Hay receipts are expected to increase for the fourth consecutive year as livestock producers continue to recover from drought-impacted low-quality forage in the central part of the nation. As always, weather and climate conditions will have strong impacts on the true outcome of this year’s price outlook. Heat, flooding and wind have battered different regions of the country in the past several weeks, bringing uncertainty to final harvest volumes and quality. Global political factors continue to cast a shadow on commodity markets. Flare-ups in the Russia-Ukraine conflict could affect farm-level prices. High production out of competing suppliers to our south, such as Brazil and Argentina, further contribute to price volatility.
On the cost side, production expenses, including operator dwelling expenses, are forecast to increase for a sixth consecutive year, growing in 2023 by $29.5 billion, or 7%, to reach a record $458 billion. And while it’s little consolation, some major input items such as cumulative fertilizers and fuels and oil are expected to decline from record highs. Fertilizers, lime and soil conditioners are expected to decrease $420 million, or 1%, from $36.85 billion to $36.43 billion. Fuels and oils are expected to experience the largest percent decline – 13% – from 2022, moving from $18.46 billion to $16.07 billion. These drops, however, are easily outpaced by increases in other expense categories including marketing, storage and transportation, which are forecast to increase 5%. Feed costs, which represent the largest single expense category, are expected to increase $2.71 billion to $86.37 billion (+3%). This is an upward revision from the forecasted decline in feed prices in the February report and is also contrary to the decline in most commodity receipt expectations. Labor costs are expected up across all subcategories with cash labor forecast to move from $41.16 billion to $43.35 billion (+5%). Heightened periods of inflation have pressured interest expenses as the Federal Reserve Bank attempts to bring inflation under control through higher rates. Between 2022 and 2023, interest expenses, including operator dwellings, are expected to jump 38%, going from $24 billion to $33.28 billion, making it more difficult for farmers and ranchers to acquire lines of credit to purchase inputs and equipment this year. Livestock, seed, electricity, and repair and maintenance are among the other categories expected to increase in price.
Other farm income, which includes things like income from custom work, machine hire, commodity insurance indemnities and rent received by operator landlords, is estimated to increase by $1.6 billion, or 3.5%, from $46.5 billion in 2022 to $48.17 billion in 2023. But when all the factors influencing income are accounted for, the resulting expectations for net farm income decline become apparent, as illustrated in Figure 4.
Other Considerations
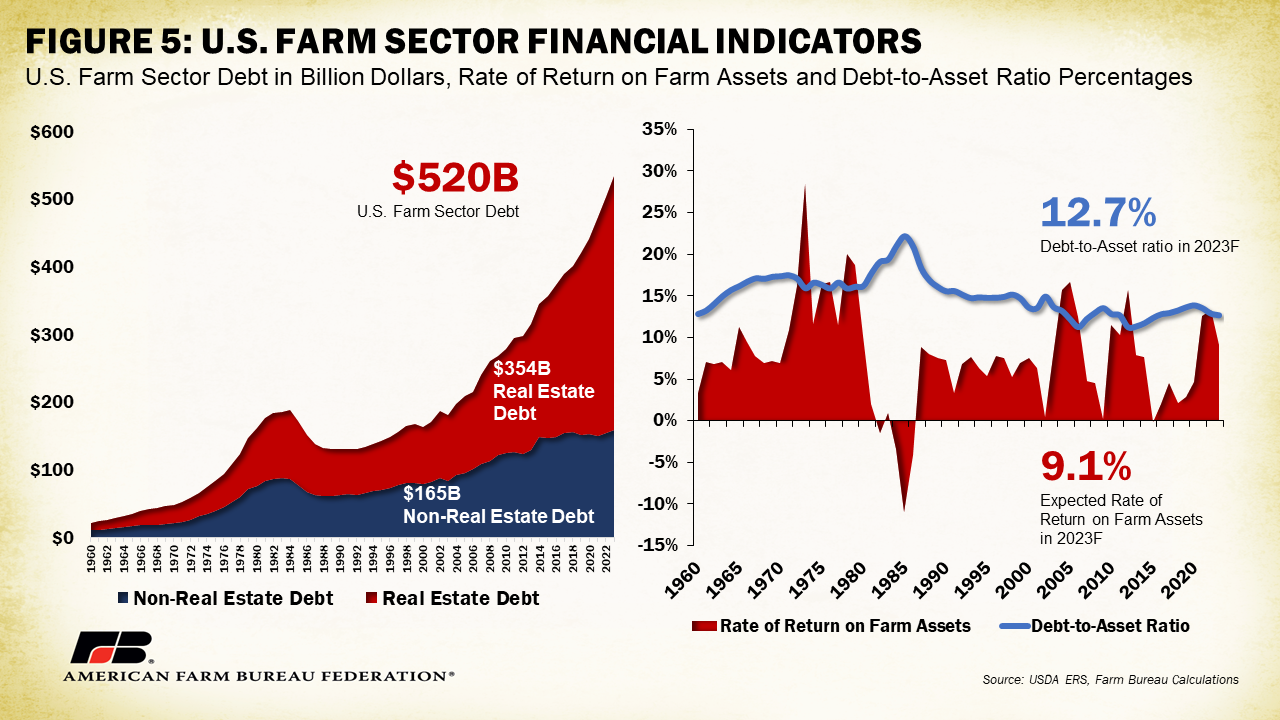
USDA’s Farm Sector Income Forecast also provides expectations of farm financial indicators that can give insight into the overall financial health of the farm economy. During 2023, U.S. farm sector debt is projected to increase $24 billion, or 5%, to a record $520 billion in nominal terms. Though a record, this is a $15-billion downward revision from the February report. Nearly 70% of farm debt is in the form of real estate debt, for the land to grow crops and raise livestock. Real estate debt is projected to increase $19.6 billion to a record-high $354 billion, largely due to an increase in land values across the country. Non-real estate debt, or debt for purchases of things like equipment, machinery, feed and livestock, is projected to increase by $4.5 billion to a record $165.7 billion. The value of assets regularly being purchased with debt is rising, which means it will continue to be important for farmers and ranchers to pay down debt and cover interest to maintain a healthy balance sheet, an endeavor that will be even more cumbersome in a high interest environment.
Based on 2023 debt and asset levels, USDA expects the debt-to-asset ratio to be 12.72% for 2023, which sits marginally below the prior five-year average (13.5%), meaning farmers are borrowing slightly less to finance the purchase of assets. Higher interest rates will likely act as a barrier for farmers to finance new assets moving forward.
Working capital, which takes into consideration current assets and liabilities, is the amount of cash and cash-convertible assets minus amounts due to creditors within 12 months. In 2023, working capital is projected to fall by $7.13 billion, or 5.5%, to $121.9 billion, which is the first decline since 2016, and sits at $880 million above 2014 levels, when farmers and ranchers held just over $121 billion in working capital. Lower levels of working capital often suggest that many U.S. farmers have just enough capital to service their short-term expenses and debt, which becomes more difficult as interest rates rise.
Another metric that highlights the concern about farmer profitability in 2022 is the rate of return on assets. For 2023, the rate of return on assets is projected at 9.1%. This is a drop from 2021 and 2022 when returns were up over 12.5% but remains above returns experienced between 2014 and 2020. Compared to 2021 and 2022, farmers and ranchers are seeing smaller revenues or returns for the investments made in the cost of production and in assets used to produce a farm product; the opposite is true from 2014-2020. Figure 5 highlights the U.S. farm sector debt, the debt-to-asset ratio and the rate of return on farm assets.
Summary
USDA’s most recent estimates for 2023 net farm income provide an updated estimate of the farm financial picture. For 2023, USDA anticipates a 23% decrease in net farm income, moving from $183 billion in 2022 to $141 billion in 2023. Much of the forecasted decline in 2023 net farm income is tied to lower crop and livestock cash receipts, continued increases in production costs and a decrease in ad hoc government support. It is important to highlight the projected nature of this forecast. 2022 net farm income numbers were not finalized until August 2023 and were adjusted upward over $20 billion in the eight months since the year ended. During this time USDA is digesting new information and data as it becomes available, shifting calculations from estimates to actual values. This means there is still much variability in 2023 net farm income. At the very least, these estimates show the relationship between, on average, falling commodity prices and rising production costs and the ultimate impact on farmers’ bottom lines. Combined with weather uncertainty and a high cost of capital to operate their businesses, farmers and ranchers will be forced to adapt as they always have. Part of being able to adapt means having clarity on rules that impact their businesses’ ability to operate, having access to comprehensive risk management options and being given a resounding voice during formulation of vital legislation such as the farm bill, which can either complicate or streamline farmers’ and ranchers’ ability to sustainably contribute to a reliable and resilient U.S. food supply.

Top Issues
VIEW ALL