USDA Lowers Corn and Soybean Supplies in Latest WASDE Report
TOPICS
USDA
photo credit: Mark Stebnicki, North Carolina Farm Bureau
Shelby Myers
Former AFBF Economist
USDA’s January World Agricultural Supply and Demand Estimates report provided a much-anticipated update to U.S. corn and soybean production for the 2020/21 marketing year. The most recent WASDE report shows a decrease in corn beginning stocks, plus lower corn and soybean yields, resulting in lower supplies of the two crops. Along with the supply adjustment for corn, on the demand side, ethanol use and corn exports were lowered. For soybean demand, crushing and exports were slightly increased. The reduced corn and soybean ending stocks helped boost price expectations in an already optimistic bull market, with corn futures trading up $4.91 per bushel at market open and soybean futures up $13.72 per bushel at market open. Today’s article reviews the January WASDE updates for corn and soybeans.
Corn
For corn supply, beginning stocks from the 2019/20 corn crop were reduced by 76 million bushels from 1.995 billion bushels to 1.919 billion bushels, reported as a change from the September Quarterly Grain Stocks report to the December Quarterly Grain Stocks. Corn yields for the 2020/21 corn crop were lowered 3.8 bushels per acre, dropping from 175.8 bushels per acre to 172 bushels per acre. In addition, total planted area of corn was reduced from 91 million acres to 90.8 million acres. The total reduction in corn production is 325 million bushels, moving from 14.5 billion bushels to 14.18 billion bushels. As a result, supply estimates have been significantly reduced, bringing the overall corn supply, i.e., beginning stocks, imports and production, for the 2020/21 corn crop to 16.1 billion bushels, down 400 million bushels from last month, when USDA estimated corn supply to be 16.5 billion bushels.
Figure 1 displays the progression of the 2020/21 corn marketing year WASDE estimates for corn beginning stocks, production, exports and ending stocks.
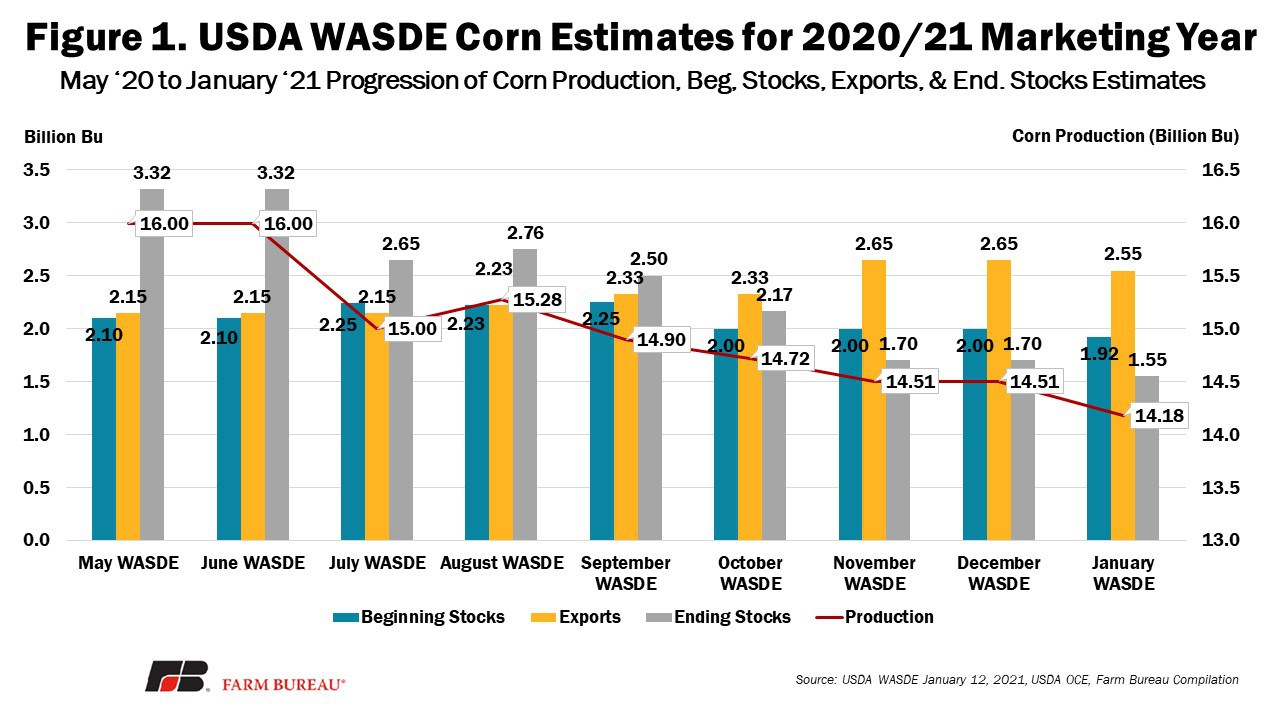
On the demand side for corn, domestic demand was lowered by 150 million bushels and export demand was lowered by 100 million bushels. The reduction in corn use for ethanol represented 100 million bushels of that domestic demand reduction, going from 5.05 billion bushels to 4.95 billion bushels. The reduction this month in demand expectations, particularly in exports, is in response to the global demand outlook for U.S. corn. While global demand has been strong as a result of competitors like Brazil and Argentina struggling with dry weather, the U.S. corn crop has quickly become more attractive to global purchasers, causing the price to rise. On top of that, Argentina’s corn export restrictions and China’s desire to import more livestock feed have many turning to the U.S. to supplement their purchases, but supplies are dwindling. Something important to note is that corn export commitments are record high, but the pace of exports is slow. As of December 31, 2020, the pace of exports for the 2020/21 marketing year was 34%, with outstanding corn sales at 28.69 MMT. This is likely a factor in USDA’s reduction of corn exports; the department includes only actual sales data, not purchasing commitments.
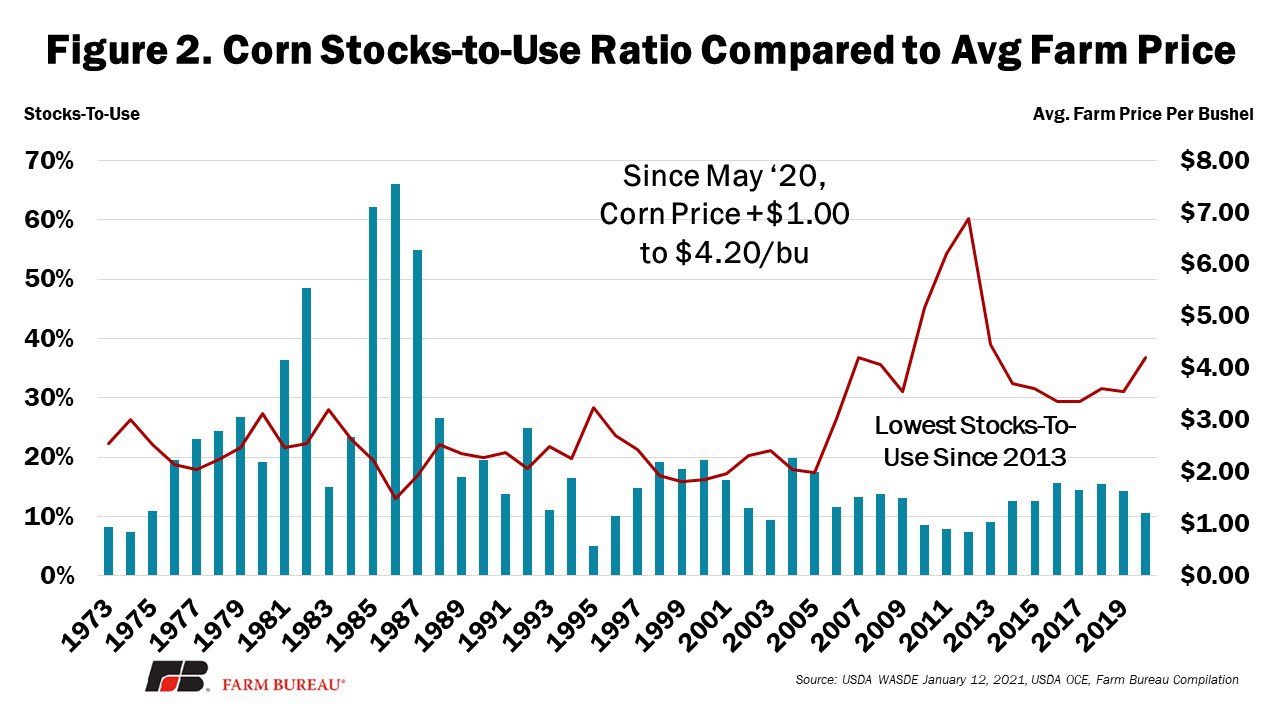
The reduction in supply and demand estimates result in an overall reduction of 150 million bushels of corn ending stocks, moving from 1.7 billion bushels to 1.5 billion bushels. Remember, this past spring, corn ending stocks for the 2020/21 crop were estimated at over 3 billion bushels (e.g., Corn Acres Should Be Reconsidered in 2020). The stocks-to-use ratio for corn is now at 10.6%, which is the lowest it has been since 2013, when the corn stocks-to-use ratio was 9.2%. With ending stocks down from last month, the price expectations for corn have increased from $4.00 per bushel to $4.20 per bushel. This is the highest corn price since 2013. Importantly, given the lengthy period during which the corn crop has gotten smaller, i.e., May 2020 to January 2021, many producers who already marketed a crop may be unable to take advantage of the recent price rally.
Figure 2 shows the historic stock-to-use ratios of corn compared to the average farm price of corn per bushel.
Soybeans
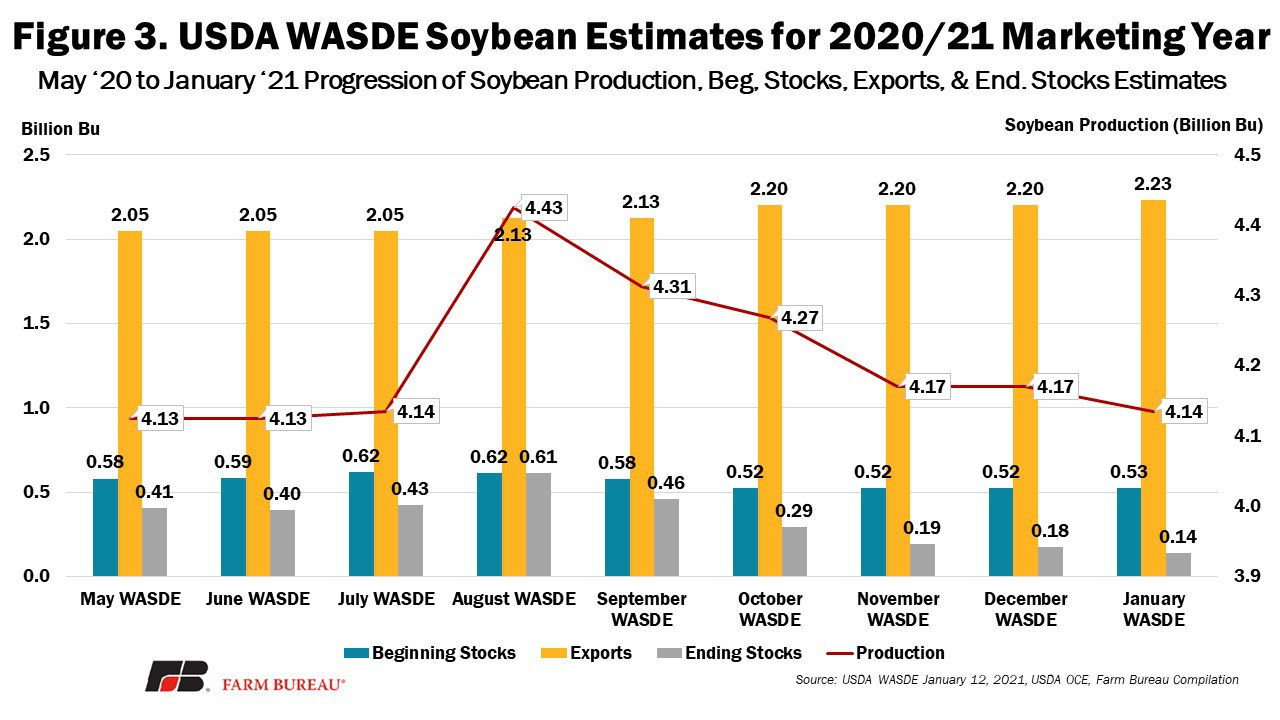
Soybean supplies did not have as large of an adjustment as corn supplies. USDA estimates total soybean supply at 4.695 billion bushels, down 14 million bushels from last month, when soybean supplies were estimated at 4.709 billion bushels. This is a result of USDA lowering yield estimates for the 2020 soybean crop from 50.7 bushels per acre to 50.2 bushels per acre.
On the demand side, soybeans got a boost in crushing and exports that helped drive up the overall demand estimates for 2020/21. Crushing rose by 5 million bushels to 2.2 billion bushels used, while exports increased by 30 million bushels to 2.23 billion bushels. The increase in soybean exports comes with the expectation that the U.S. will be the go-to alternative as competitors, like Argentina, pull back on their exports in fear of rising domestic livestock feed costs.
Figure 3 displays the progression of the 2020/21 soybean marketing year WASDE estimates for beginning stocks, production, exports and ending stocks.
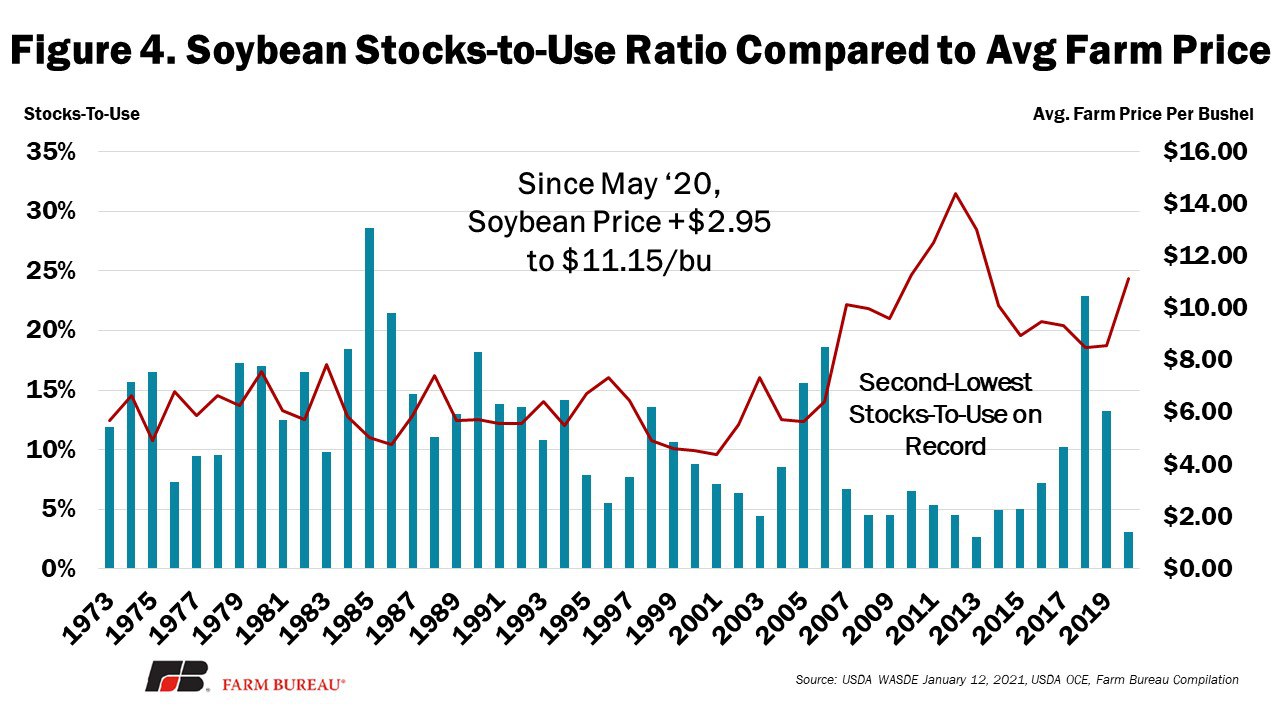
The even tighter supplies of U.S. soybeans and increased demand are evident in this month’s stocks-to-use ratio, which is lowered from 3.9% to 3.1% -- the lowest since 2.6% percent in 2013. Last year, the soybean stocks-to-use ratio was 13%. Ending stock estimates were pushed even lower, going from 175 million bushels last month to 140 million bushels. The expectation of tighter supplies pushed the average soybean farm price from $10.55 per bushel to $11.15 per bushel.
Figure 4 shows the historic stocks-to-use ratios of soybeans compared to the average farm price of soybeans per bushel.
Summary
Everyone expected the WASDE released yesterday to raise eyebrows. The data-heavy January report is known to cause markets to move. The realities lived up to expectations. First, the further reduced beginning stocks of corn for the 2020/21 marketing year and the reduction in production estimates moved corn supplies even tighter.
Second, global corn demand is beginning to slow as global buyers pull back from purchasing at high prices, and in some cases, high prices with additional tariffs. Third, U.S. soybeans are currently the only game in town, and as a result, supplies are dwindling rapidly. But, we have had similarly low soybean ending stocks before, all the way down to 92 million bushels in 2013, so there’s room to go lower. Fourth, high soybean prices could incentivize even more 2021 plantings than the early predictions of 89 million acres of soybeans, up 7% from 2020 (see First Glimpse at 2021 Acreage and Yields). Regardless, money is flowing into the commodities market and futures prices for corn and soybeans are at their highest levels in six years.
Top Issues
VIEW ALL