What’s the Reason Behind the Difference in NASS and FSA Acreage Data?
TOPICS
USDAMichael Nepveux
Former AFBF Economist

photo credit: AFBF Photo, Right Eye Digital
Michael Nepveux
Former AFBF Economist
This summer has been one for the history books in terms of USDA crop reports, weather-induced planting delays, commodity market uncertainty and general craziness across farm country. The historically wet planting season put agricultural markets on a wild roller coaster ride with the peaks and troughs of the tracks marked by official USDA reports and the strong market reactions that followed.
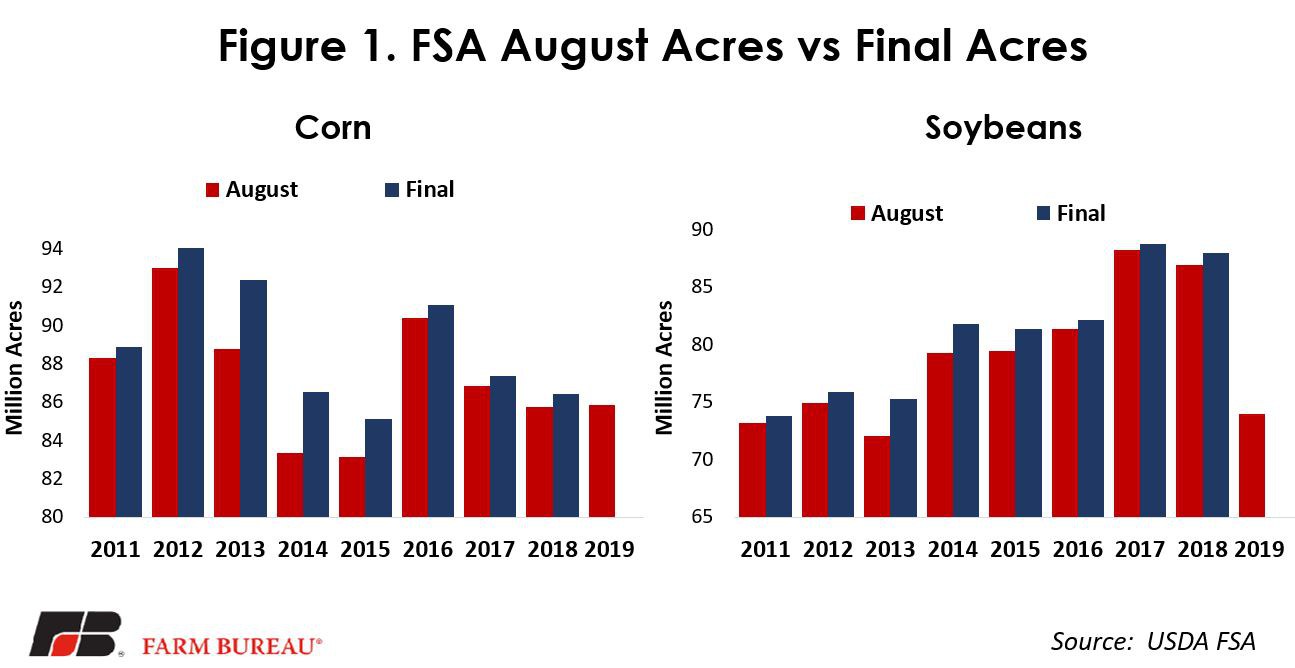
On August 12, USDA’s Farm Service Agency released data on reported acreage as of August 1. On that same day, USDA’s National Agricultural Statistics Service released its August 2019 Crop Production report, which included the much-anticipated results of the resurvey of acreage following the June 28 Acreage report. Both the NASS and the FSA reports came in well above industry expectations, sending the agricultural markets into a tailspin. As the dust was settling from these recent events, many questions arose as to why these USDA agencies were reporting different numbers. NASS had reported 90 million acres of corn planted while FSA had reported 85.8 million acres. Similarly, NASS reported 76.7 million acres of soybeans to FSA’s 74 million acres. To delve into this, it is important to understand what data each agency is reporting and where it comes from.
FSA Data
Any producer who participates in USDA farm programs must report their acreage to FSA. This data is categorized by the producer as either planted, failed or prevented. Typically, the deadline to report is July 15, but this year FSA extended that deadline to July 22 for 12 states that were severely impacted by widespread flooding and excessive moisture. One common pattern that occurs every year is that FSA reported acreage on August 1 will typically be less than the final reported acreage.
NASS Data
The considerable weather challenges farmers faced as they were trying to get their crops in the ground proved very problematic for NASS, requiring the agency to make some very difficult calls during an unprecedented situation. The NASS June Acreage report estimated planted and harvested acreage based on a farmer survey conducted between May 30 and June 14. Then, as we all know, historic planting delays resulted in large amounts of acreage still labeled as “intended to plant” in the June report, prompting NASS to reconduct the survey from July 8 – July 24 in many states. NASS utilized these survey responses in conjunction with satellite imagery data when determining the updated acreage estimates.
Why are the two agencies reporting different numbers?
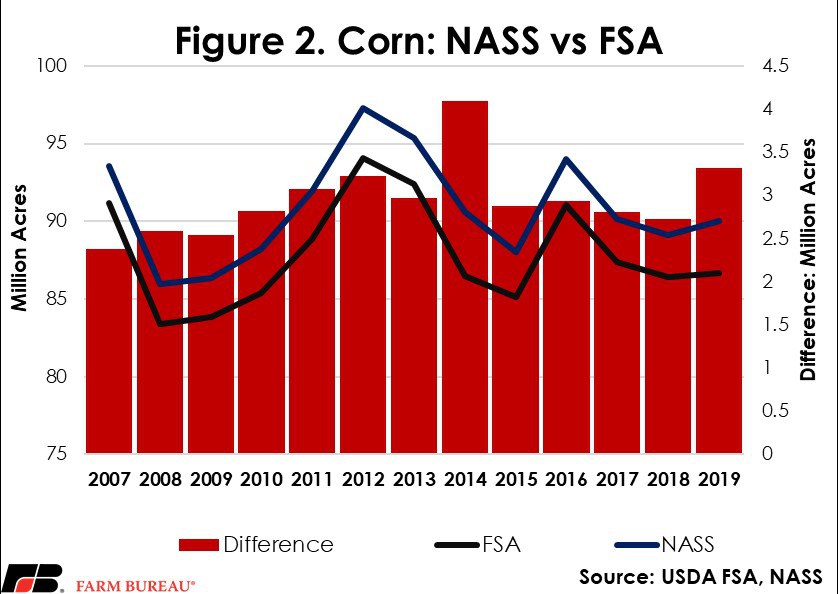
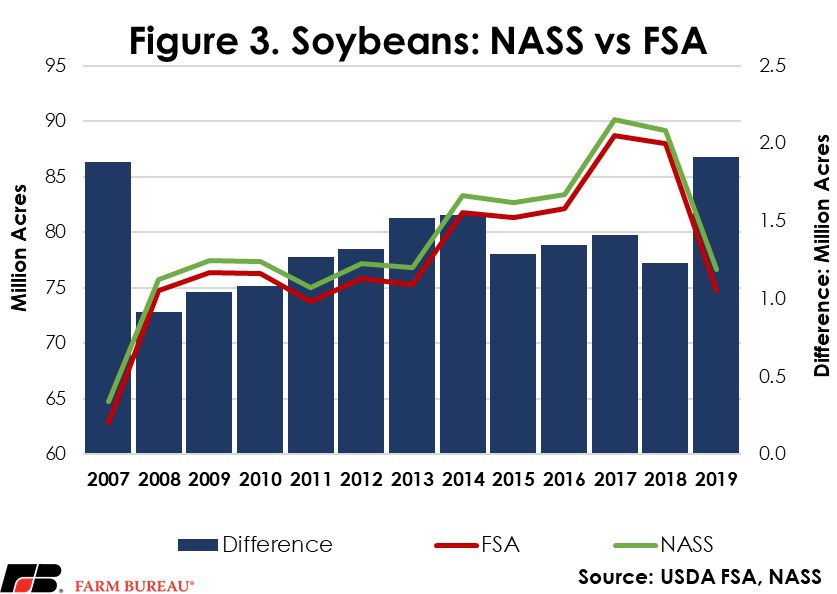
This all brings us to the main question of the difference between the two agencies. The primary reason for the difference lies in something we already discussed: FSA requires producers who participate in farm programs to report their acreage to the agency. Not all producers in the country participate in USDA farm programs, so not all producers are reporting their acreage to FSA.
In contrast, NASS attempts to estimate ALL planted acreage, regardless of whether or not a producer is participating in USDA farm programs. As a result, NASS reported planted acreage will consistently be larger than the planted and failed acreage reported to FSA. After the August FSA report, FSA will issue several more updates through the rest of the year, and typically these reports bring the FSA data closer to the NASS data. NASS actually frequently utilizes FSA data in developing its own estimates. Keep in mind that FSA breaks out acres that have been planted but failed from planted acres that yield a crop. These combined FSA categories are comparable to the NASS planted acres definition in their corn and soybean acres.
Other Differences in Reporting Data
In addition, the agencies differ on the reporting of prevented planting and cover crops. FSA collects data on acres that were prevented from being planted, while NASS does not collect this information and does not include prevented plantings in their reported acreage numbers. On the reporting of cover crops: if corn is planted as a cover crop, for example, NASS will include this in the total acreage planted for corn. However, FSA defines any crop planted as a cover crop as just that, a cover crop, in the FSA reported acres. As a result of this classification and the prevented planting classification, the same acres could be counted as prevented planting for one crop and then counted again if there is a cover crop planted on them. Typically, if a producer plants a cover crop on prevented planting acres, they may receive 100% of their prevented planting payment through their crop insurance policy if the crop is cut or grazed after November 1. However, in part due to concerns of a shortage of forage in much of the country, for 2019 this date was pushed up to September 1. Additionally, for 2019, producers who were prevented from planting their intended crop will be eligible to receive a $15/acre payment from the Market Facilitation Program if they plant an approved cover crop.
Newly Released FSA data
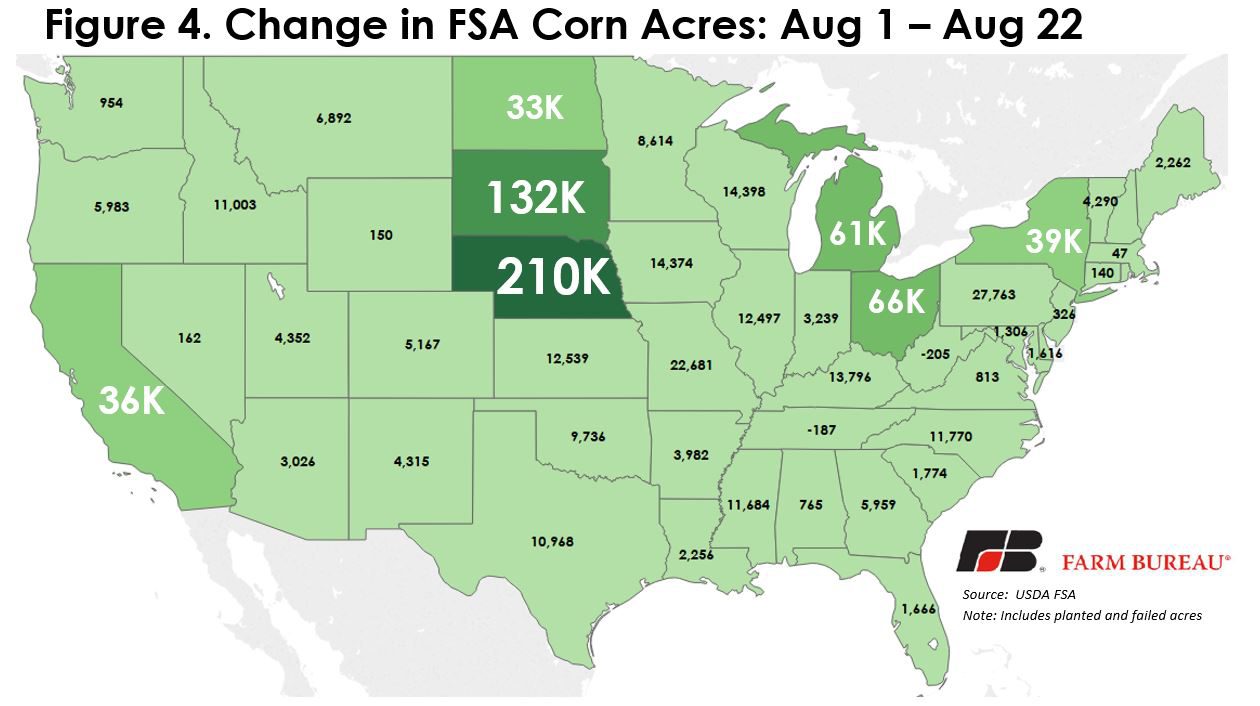
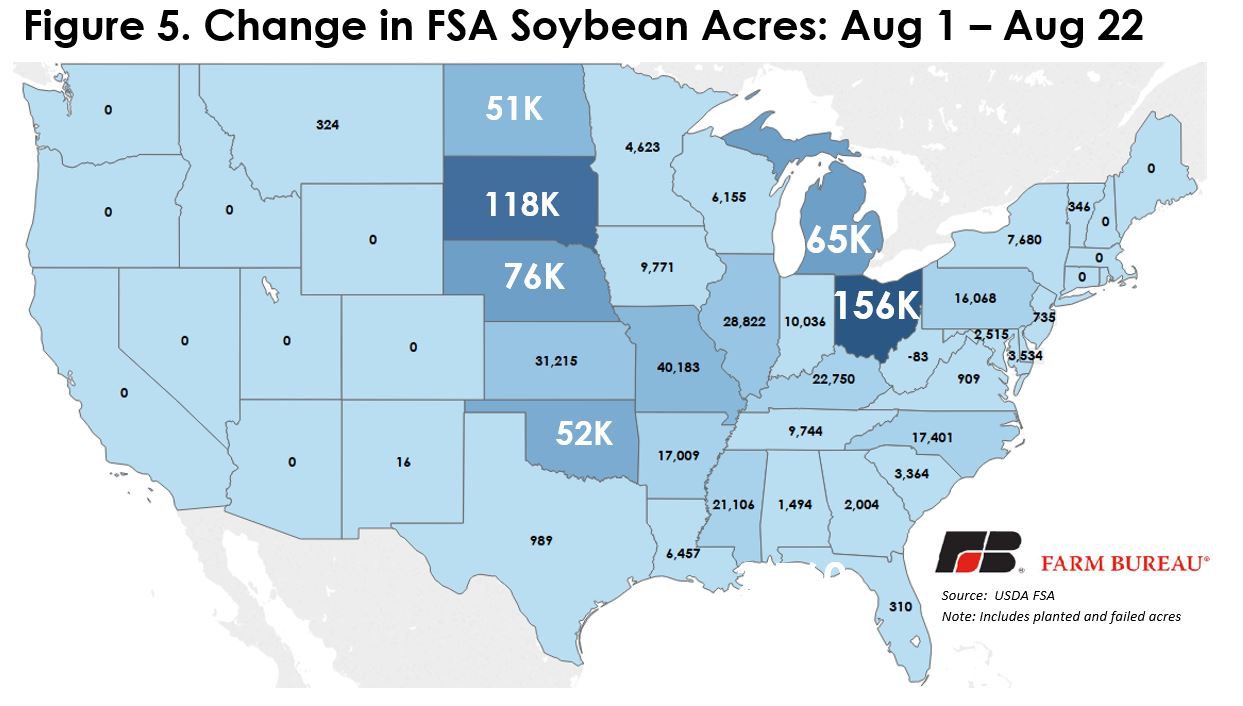
On August 27, FSA released updated acreage data as of August 22. As was mentioned earlier, one can expect each FSA update to add acreage and bring it somewhat closer to the NASS reported number.

For both corn and soybeans, roughly 800,000 acres were added to the FSA planted and failed acreage since the August 1 report. Figure 4 and Figure 5 show the change in corn and soybean reported acres between August 1 and August 22. Additionally, as of August 22, prevented plantings reported to FSA across all crops equaled 19.8 million acres, 11.4 million acres of which was corn and 4.5 million acres of which were soybeans. Between August 1 and August 22, FSA prevented planting acreage increased by over 300,000 acres.
Top Issues
VIEW ALL