Check, Please! More U.S. Consumers are Dining Out
Megan Nelson
Economic Analyst

photo credit: Alabama Farmers Federation, Used with Permission
Megan Nelson
Economic Analyst
In the September edition of the Food Expenditure Series, USDA’s Economic Research Service indicates U.S. consumers spent a record $1.62 trillion on food and beverages in 2017. Of the total food expenditures, 53.8 percent, or $869 billion, went to food purchases away from home. Food purchases at home equated to 46.2 percent of total food expenditures, representing $746 billion in 2017. When alcoholic beverages are included, total food expenditures were a record $1.83 trillion, with 53 percent, or $980 billion, consumed outside the home. Figure 1 illustrates the growing gap in food and beverage expenditures over the past 20 years.
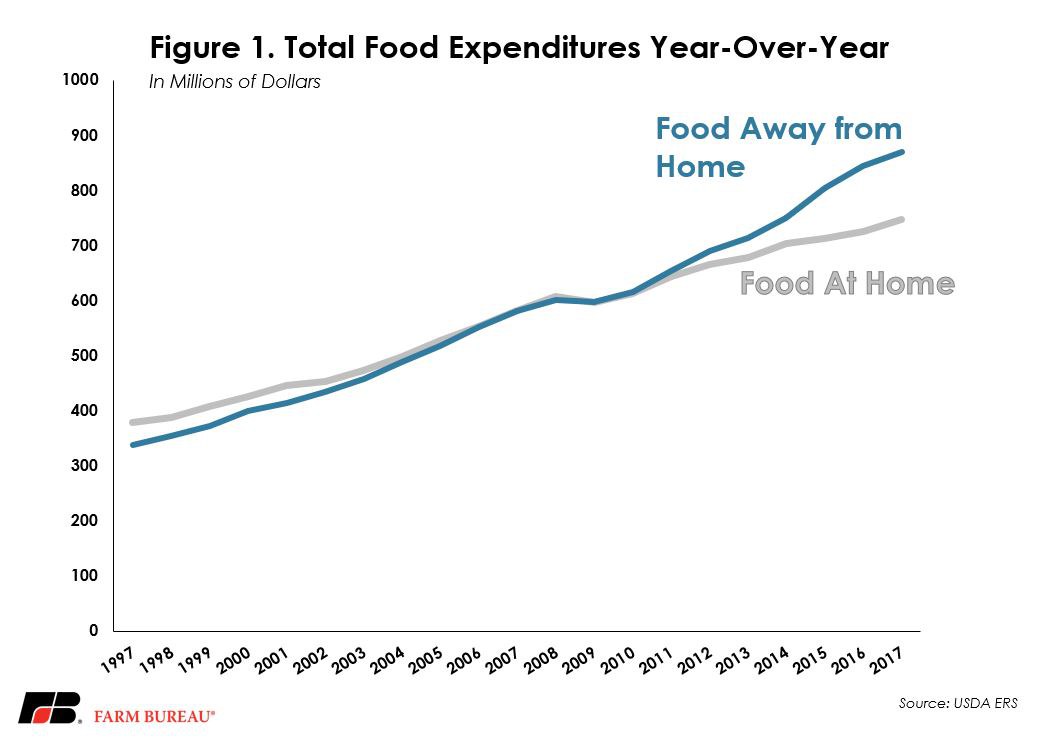
The Food Expenditure Series has been following the value of the U.S. food system since 1869. This rich data set allows for manufacturers, retailers and policymakers to observe and learn from food spending and food supply trends. The series focuses on the magnitude and distribution of food expenditures in the U.S, primarily within the bounds of dollars spent on food at home and food away from home. Food-at-home expenditures are defined as purchases of food at grocery stores and other food stores where the final purchaser is the consumer. Food-away-from-home expenditures include meals and snacks supplied by commercial food service establishments.
Beginning in 2010, the percent of total food-at-home expenditures has been slowly decreasing year-over-year as food-away-from-home expenditures increased. One contributing factor to the larger share of food consumed outside of the home is rising national income. As the national median income rose from the 20 year low of $54,569 in 2012 to $61,372 in 2017, individuals’ propensity to dine out rose too. In 2017, food-away-from-home purchases increased $24.7 billion from the $844.5 billion spent in 2016. Full- and limited-service restaurants remain the largest portion of food-away-from-home expenditures; however, drinking establishments saw a 116 percent increase from 2016 to 2017. In contrast, grocery stores hold the largest portion of food-at-home dollars, with $436 billion spent in 2017. The two sectors that decreased from 2016 to 2017 in food-at-home spending were dollars spent at mass merchandisers and direct sales by farmers, manufacturers and wholesalers.
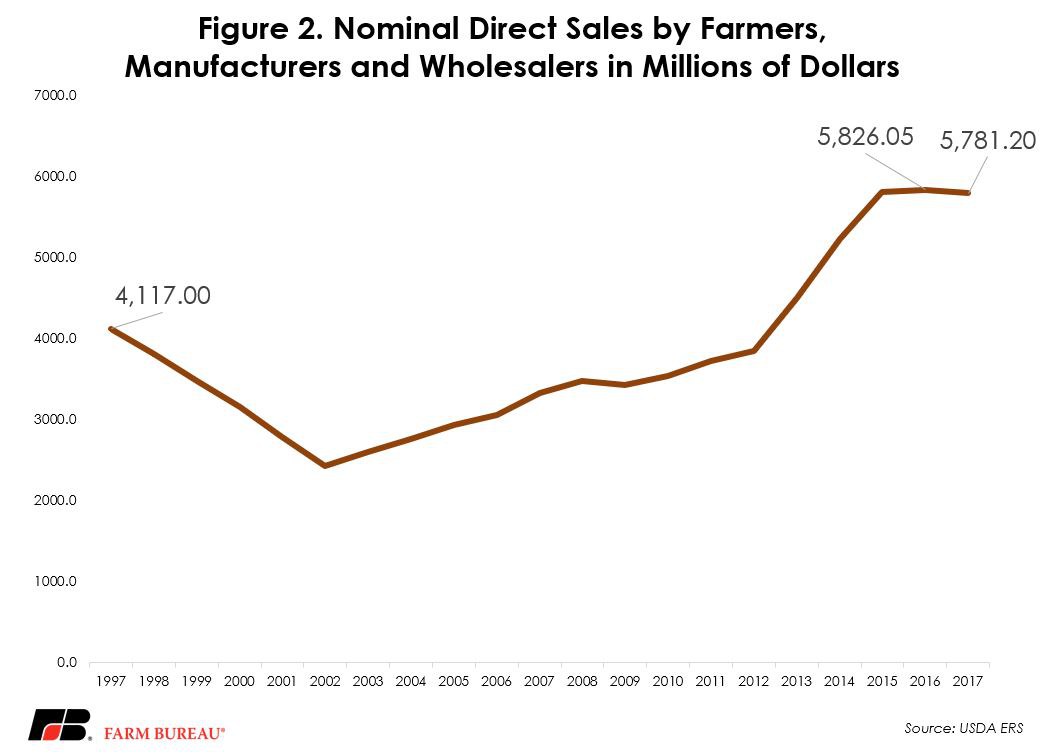
The decrease in direct selling means the farmer’s share of the food dollar has decreased even further. Direct farm, manufacturer and wholesaler sales have stagnated since 2015, and have decreased by $45 million since 2016, Figure 2.
Additionally, given that at 4.4 cents, the farmer’s share of the food dollar outside of the home is lower than the farmer’s share of food consumed at home, the rising proportion of food consumed outside the home contributes to an overall lower share of the food dollar that goes to the farmer. This is evidenced in USDA’s recent Food Dollar Series, which indicated that the farmers’ share of the food dollar fell to 14.8 cents for 2016, down 4.5 percent from 2015.
Top Issues
VIEW ALL