Farmer Survey Response Decline a Growing Problem
TOPICS
USDA
Bernt Nelson
Economist
Samantha Ayoub
Former AFBF Economist
On August 28,2025, NASS announced the cancellation of the Farm Labor Survey. The discontinuance was officially posted to the Federal Register on September 3.
Countless stakeholders including farmers, university Extension services, researchers and policymakers rely on the data USDA has collected for more than 150 years through agencies and programs including the National Agricultural Statistics Service (NASS) and the Economic Research Service (ERS).
An important element of research, price discovery and market integrity, good data is a critical part of a robust, well-functioning agricultural economy. USDA is considered the gold standard for data collection globally but decreasing responses to USDA’s farmer surveys is putting the integrity of this data at risk.
This Market Intel will evaluate the changes in response rates over time for several key surveys, with a focus on three NASS examples: the Crop Production Annual Summaries report, the March Cattle On Feed report and the November Farm Labor Survey.
It’s All About Data
Paid for by tax dollars, USDA’s data and reports are available to a massive number of public and private stakeholders.
USDA collects data in a variety of ways. For example, USDA’s Farm Service Agency (FSA) relies on producer-reported data during enrollment for programs such as Agriculture Risk Coverage and Price Loss Coverage. Other agencies, such as NASS, often rely on data collected through various surveys including USDA’s Census of Agriculture, which occurs every five years. NASS alone conducts hundreds of surveys every year, ranging from county-level production to cattle on feed.
Surveys Responses: Timing is Everything
One of the biggest challenges to getting good survey response rates is timing. Unfortunately,many survey collection periods overlap with farmers’ busiest times. For example, leading up to the June 30 planted acreage report, NASS contacted nearly 92,000 farmers across the nation to collect data to determine planted crop acres as of June 1. This overlaps with the end of planting season and spraying season for many row crop farmers. This survey is critical because it helps determine expected acreage, the foundation for estimating future supply for several major U.S. commodities. The weaker the survey response rates, the less accurate the data.
Crop Production
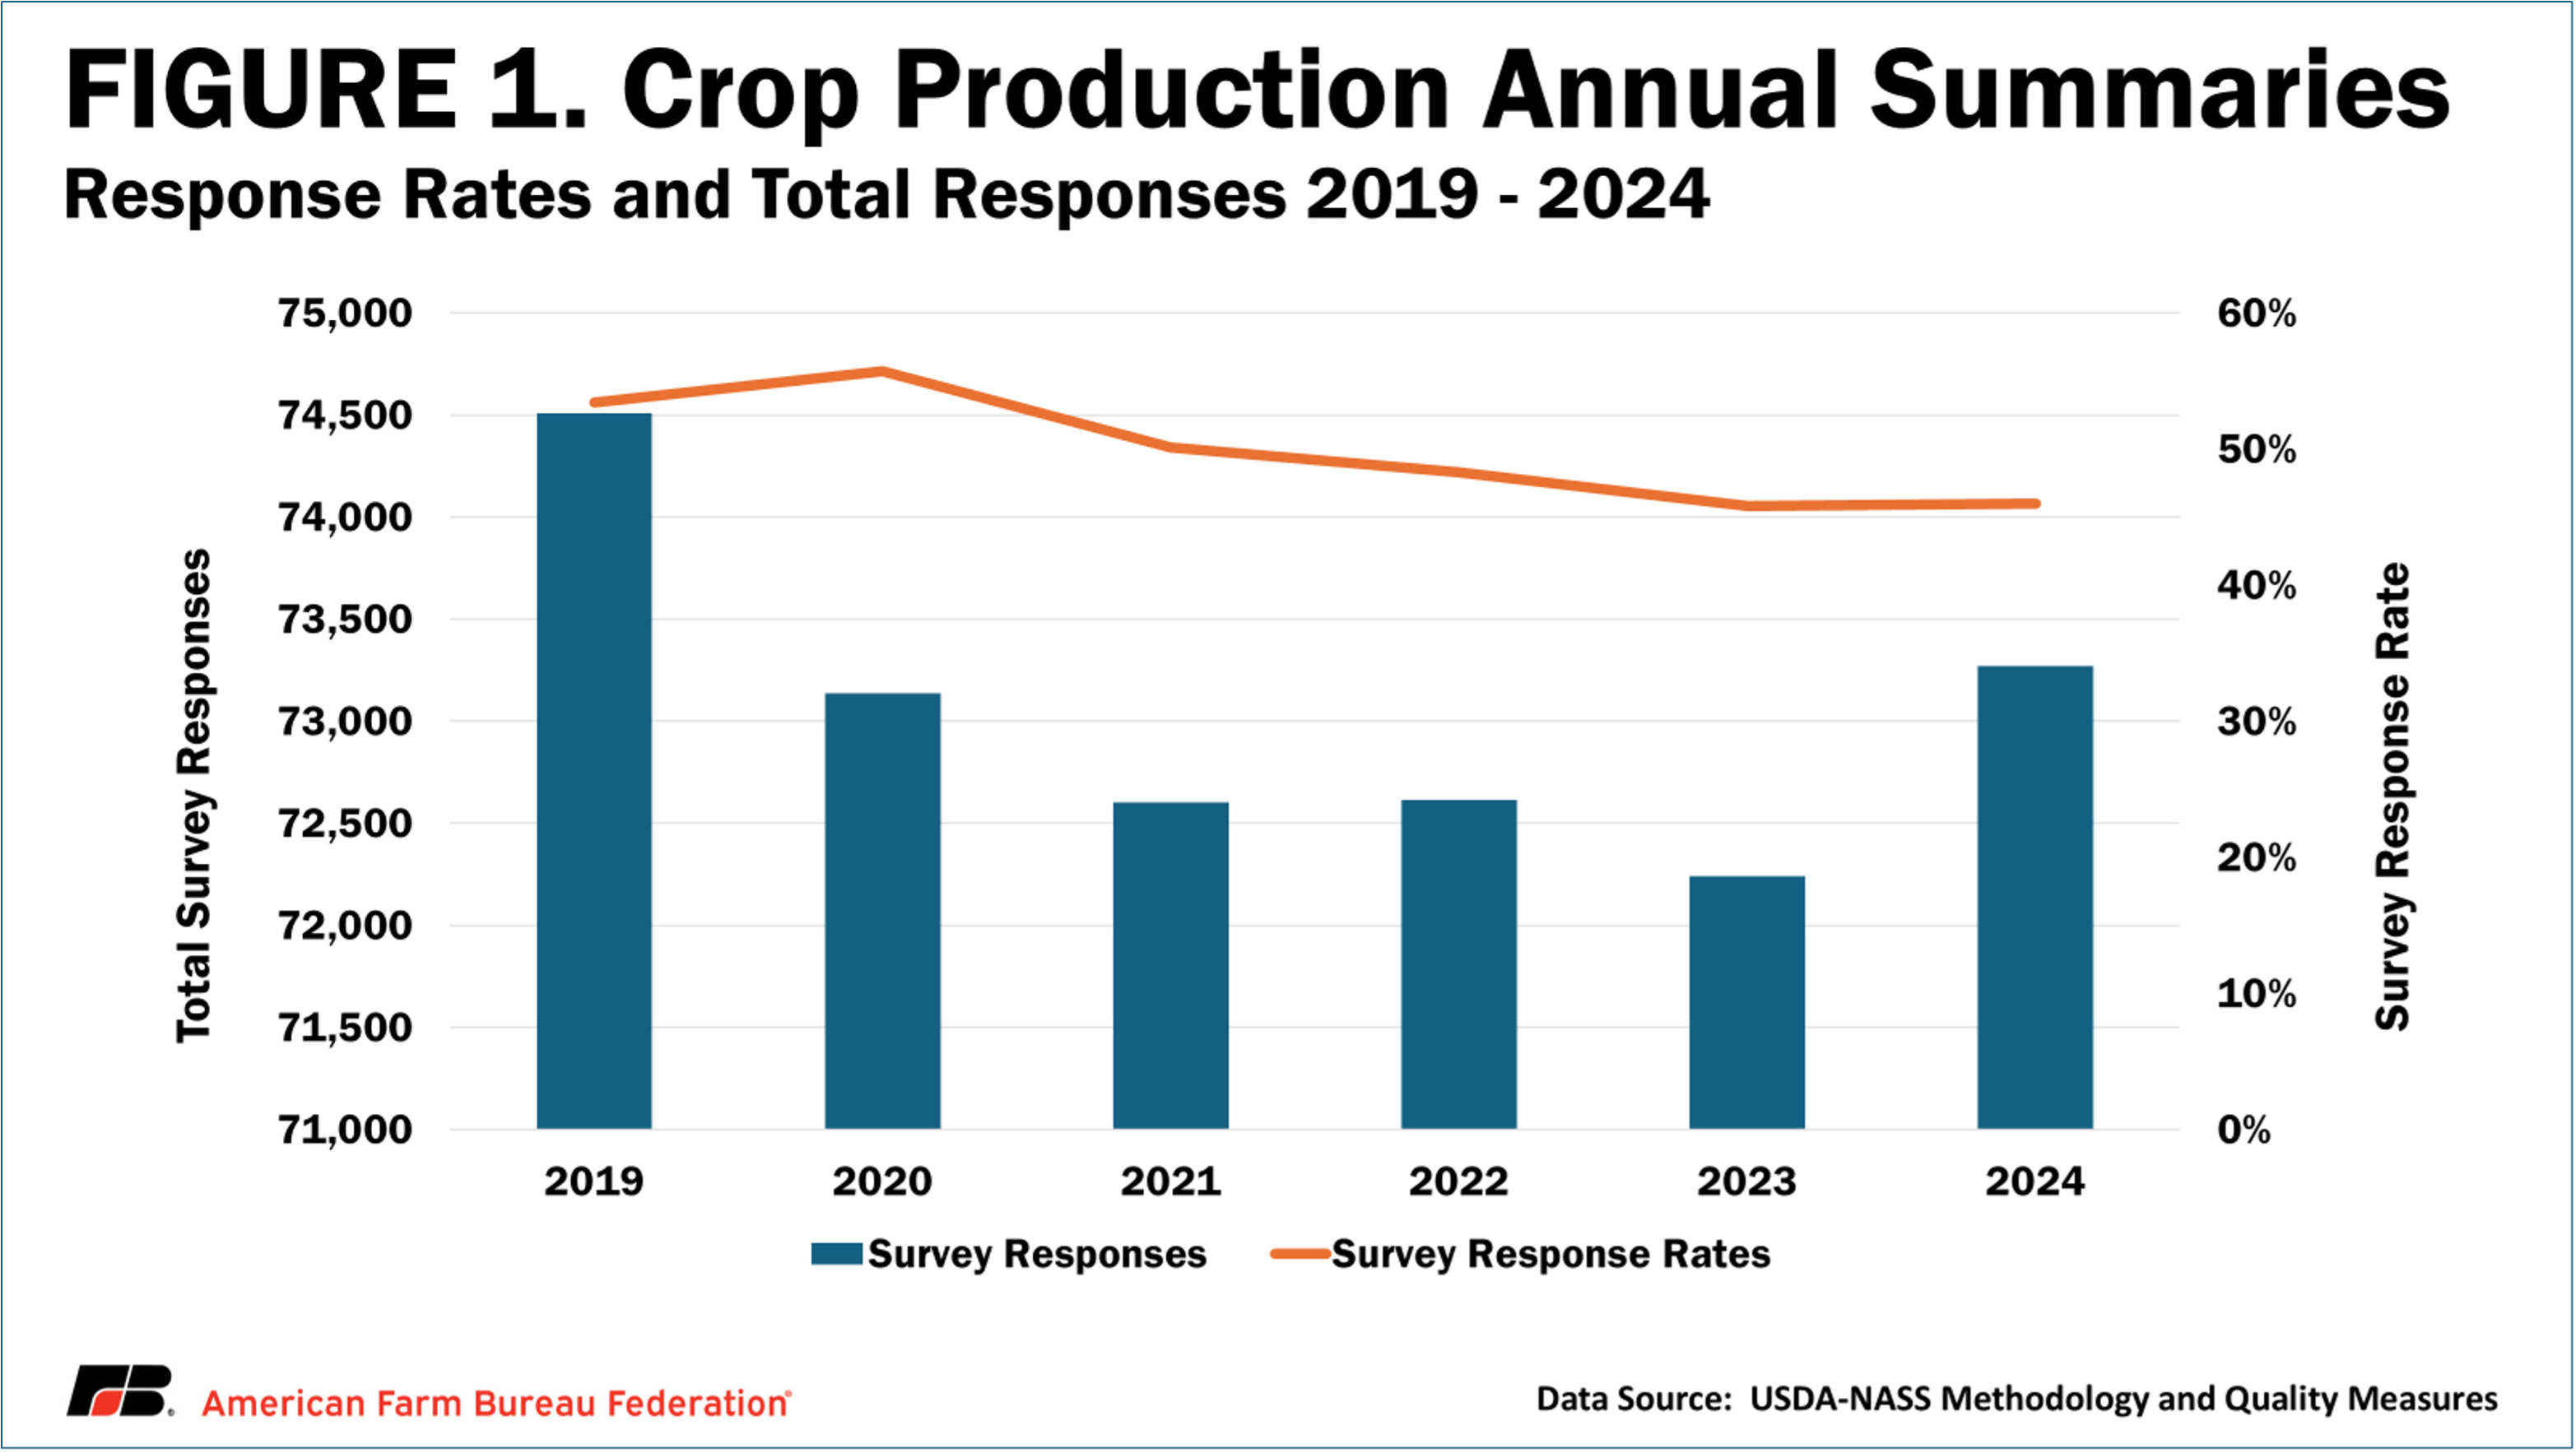
Estimates for row crop acreage and production come from USDA’s quarterly Agricultural Production survey issued in March, June, September and December in all states other than Hawaii. This data, published in the Crop Production Annual Summaries, is used widely due to the wide swath of information it contains. It is used by farmers to make decisions about marketing or storing grain, financial institutions for analyzing credit decisions, industry analysts for developing forecasts and many more. This makes data integrity crucial. Response rates for these surveys have fallen from 80%-85% in the 90s to just 46% in 2024. Notably, between 2019 and 2024 the response rate dropped below 50% for the first time with fewer than 74,000 responses out of an average of 148,000 surveys issued since 2020 (Figure1).
Cattle on Feed
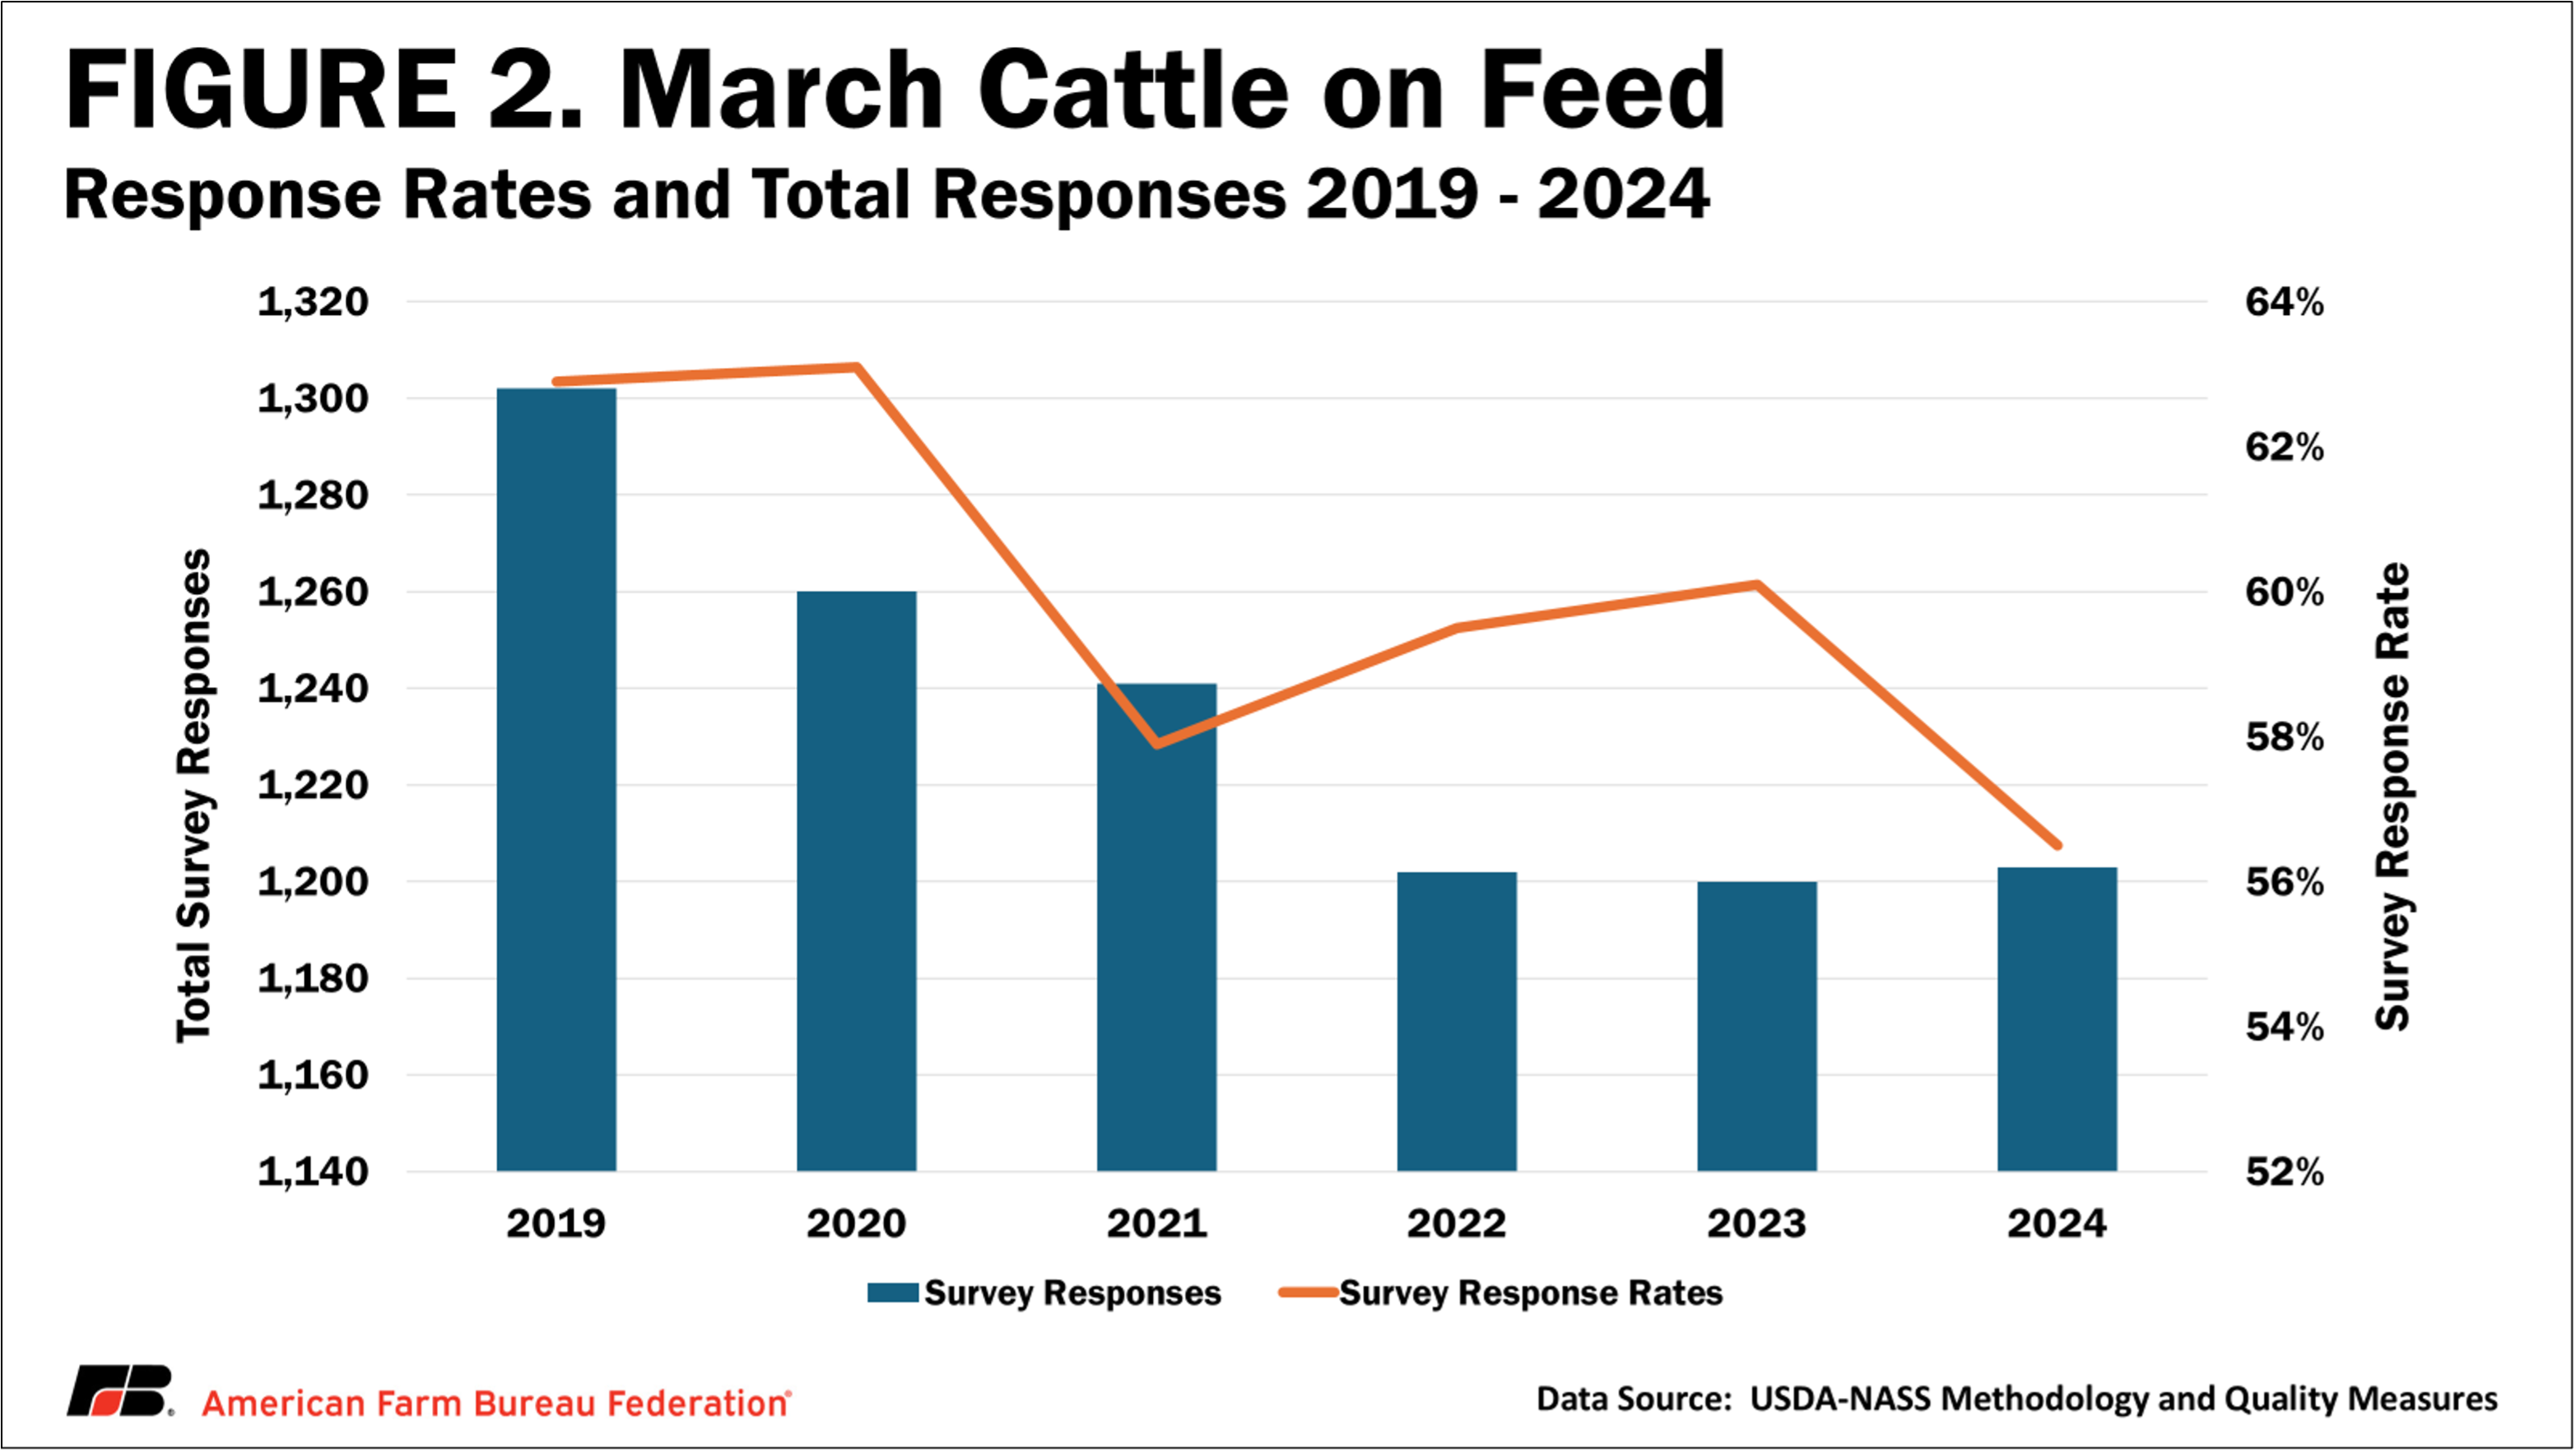
USDA’s monthly Cattle on Feed report estimates the inventory of cattle on feed, cattle placed into feedlots, cattle marketed, and other disappearance by weight class. This report is important because it provides estimates for cattle in the pipeline for beef production. Stakeholders rely heavily on this data for beef cattle price discovery and market decisions for all levels of production, from the farmer or rancher all the way to the retailer. Surveys for this report are issued to farmers and ranchers with feedlots with a capacity of 1,000 head or more in 17 states. For quality measures, USDA uses the March report as a benchmark. The total number of March surveys sent to farmers and ranchers by USDA has increased by 3%, from 2,070 to 2,129 since 2019. During the same period, total responses have fallen by 6%, from over 1,300 down to about 1,200 for an overall response rate drop of 8% since 2019 (Figure 2). Survey response rates for this market-moving report have steadily declined, slipping from over 62% in 2019 to just above 56% in 2024, edging closer to a concerning 50% threshold. As fewer feedlot operators respond to USDA’s benchmark March survey, confidence in cattle supply data used for price discovery and market decisions becomes increasingly fragile.
Farm Labor
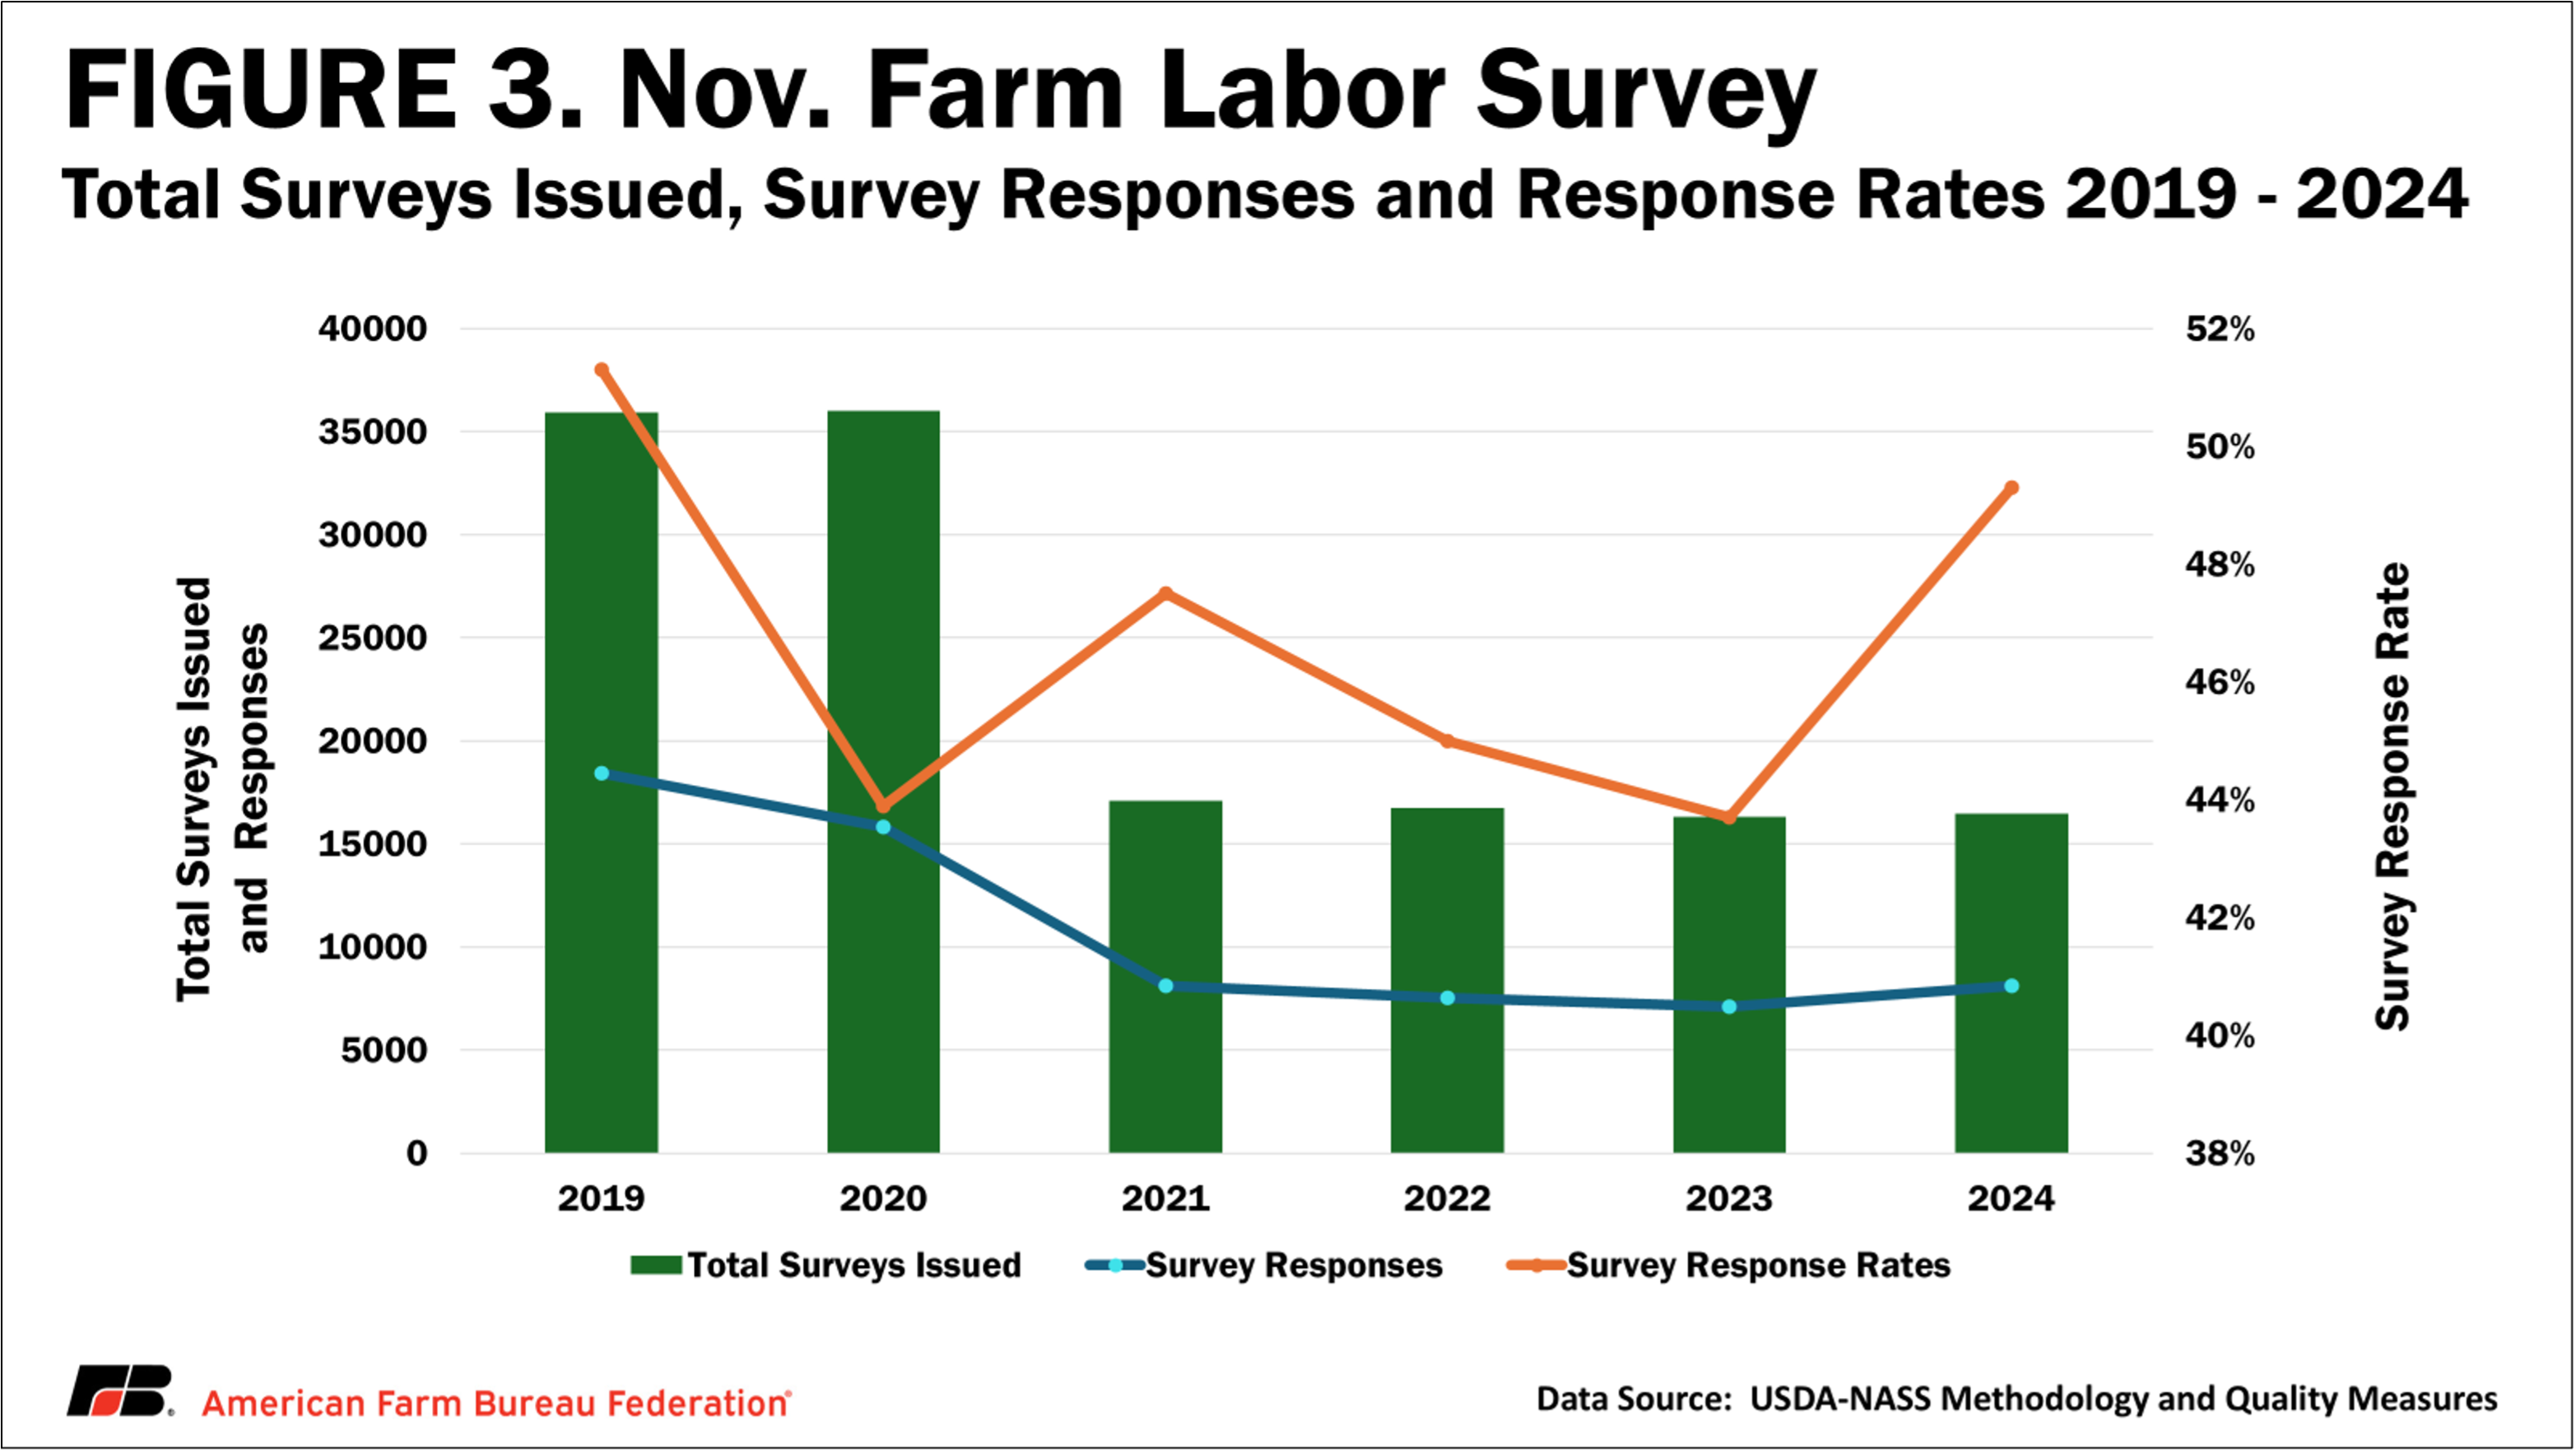
USDA’s Farm Labor report is an annual publication containing regional data for all hired, unpaid and self-employed workers directly hired by U.S. farms and ranches (excluding Alaska), including wage rates. (Figure 3).
The Farm Labor survey has crucial policy implications as it is used by the Department of Labor (DOL) to establish minimum wage rates, known as the Adverse Effect Wage Rate (AEWR), for the H-2A temporary agricultural guestworker program. Because of flaws in using this survey as a policy discovery tool, NASS has tried multiple changes to the survey over the years.
In 2019, NASS added additional questions on base wage rates – those excluding incentive pay, overtime pay, etc. – to try to better serve DOL’s use of the survey as an indicator of base wages across the country. To accommodate these extra questions, as well as to include more information on wages, NASS increased their sample size to over 35,000 surveys. These surveys are divided among the 18 state and multistate regions by which the data is aggregated and reported. The survey historically had survey response rates of over 50% or 60%. However, when the survey sample increased to 36,000 surveys in 2020, the response rate declined to less than 44%.
NASS abandoned their new methodology after only two years and reverted to a sample size of only 17,000. This is still above the historic average sample size of 12,000 surveys. Yet response rates have not recovered. As wages in the Farm Labor report – and the H-2A AEWR – continue to volatilely increase compared to nonfarm wages, many farmers view the survey with increased skepticism. As of the May 2025 survey, the response has again decreased, dropping 4 percentage points from the November 2024 survey. The trends in the Farm Labor survey are a prime example of how lack of transparency, falling data quality and improper use can weaken industry trust, participation and expectations for public data.
Falling Survey Response Impacts
Among the many reasons falling response rates are a problem, perhaps the most glaring is the declining data integrity that goes along with it. Lower response rates could lead to lower accuracy. If too few responses are collected for any certain statistic, NASS will remove that statistic from public data to maintain confidentiality for farmers that did respond. If a certain group or demographic has a particularly high number of responses compared to another, this can also lead to added bias.
Reliable survey data helps keep markets fair and competitive. USDA is the gold standard in agricultural data publications that are used for price setting across the globe. A decline in data quality could lead to less reliance on U.S. data, reducing global competitiveness.
Price discovery is the process where buyers and sellers negotiate and agree on a price for agricultural commodities. It involves the interaction of supply and demand, as well as other market factors, to determine the market price for a certain good. Less reliable data leads to less transparent markets, which can cause problems for price discovery.
Efforts to Improve Survey Response Rates
NASS has taken several steps to attempt to increase survey response rates. In the past, NASS issued surveys by mail. NASS began offering surveys online in the early 2000s. Online surveys cut down on time and cost of data collection for farmers and NASS alike. NASS has streamlined the process by developing shorter questionnaires and expanding communications to include email and text messaging. These methods are far more time-efficient and cost-effective than the in-person requests and phone calls that used to be standard. NASS has also enhanced data analysis methods and outreach. Lastly, NASS seeks to educate farmers on the importance of survey responses. It takes time to fill out these surveys, but robust survey response rates are integral to keeping USDA data the gold standard of agricultural data.
Conclusions
Most of the data published by USDA relies on farmers stopping their daily work to respond to surveys, which is no small ask. Surveys compete with weather, veterinary emergencies and a variety of endless seasonal farm activities. This competition for time has led to a major decline in response rates to surveys that produce the data that farmers rely on to make decisions on a daily basis. Though USDA has made some improvements to surveys, response rates for many surveys continue to decline. USDA leadership should continue to examine ways to increase participation, and data reliability, without imposing more burdens on the already busy growers whom the data is designed to serve.

Top Issues
VIEW ALL