Is Farm Income Really Up?

photo credit: Getty Images
John Newton, Ph.D.
Vice President of Public Policy and Economic Analysis
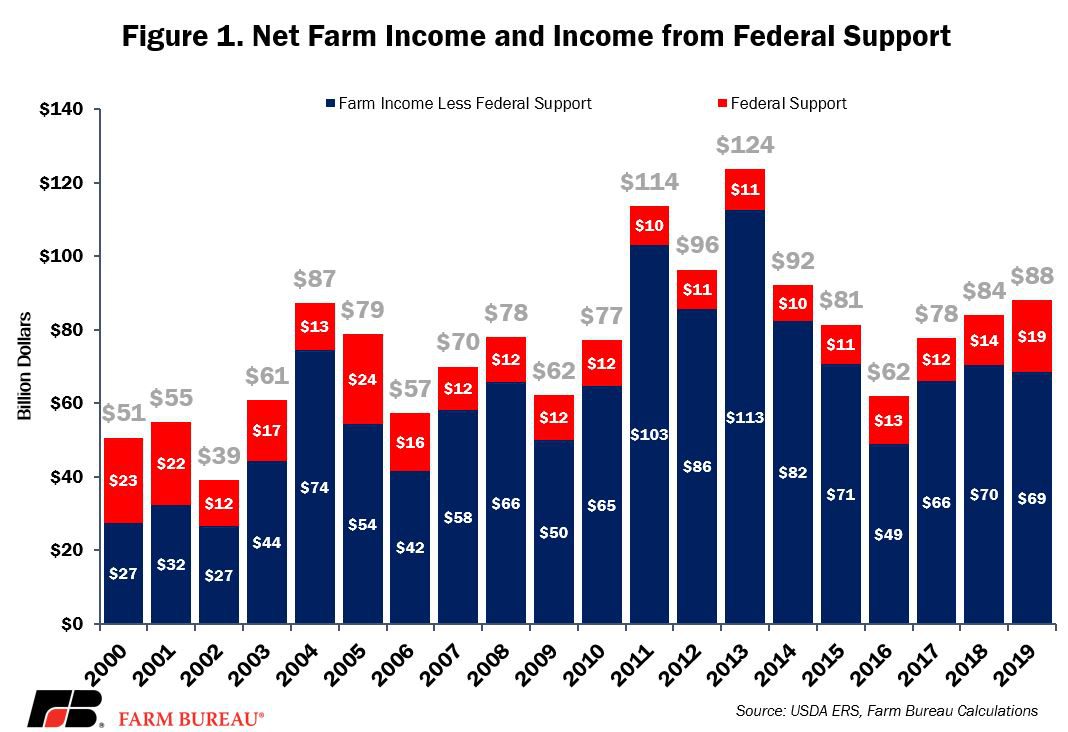
The USDA-Economic Research Service’s recently updated forecast for farm sector income and finances puts net farm income, a broad measure of farm profitability, at $88 billion for 2019, up $4 billion from 2018 and up $10 billion from 2017. Importantly, the new projection is nearly $20 billion higher than the March 2019 estimate of $69 billion. The improvement in net farm income is primarily driven by an increase in federal support, i.e., trade assistance and insurance indemnities related to Midwest flooding this spring, and a reduction in operating expenses. If realized, net farm income in 2019 will be the highest since 2014 and will represent three consecutive years of rising farm income, Figure 1.
Real-Time Indicators Say Otherwise
However, the optimistic projection on farm profitability doesn’t match real-time indicators typically used to measure the health of the farm economy. Land values and cash rents are falling in some areas. Agricultural land values were down 14% in Iowa, 4% in Indiana and 3% in Illinois (Land Values and Cash Rents Falling in Some Areas). Similarly, cash rents in the I-State corridor were down as much as 11.5% over the last five years. In Minnesota, cash rents have fallen nearly 12% since 2014.
Another indicator of farm profitability is farmers’ and ranchers’ ability to service their debt. Federal Deposit Insurance Corporation quarterly call report data revealed the delinquency rate, i.e., loans more than 30 days past due, for commercial agricultural loans in the second quarter of 2019 at 2.1% -- the highest level since 2012. While delinquency rates are well below historical highs, they continue to climb for both real estate (2.3%) and non-real estate loans (1.8%). Clearly, more farmers and ranchers are having trouble servicing their debt.
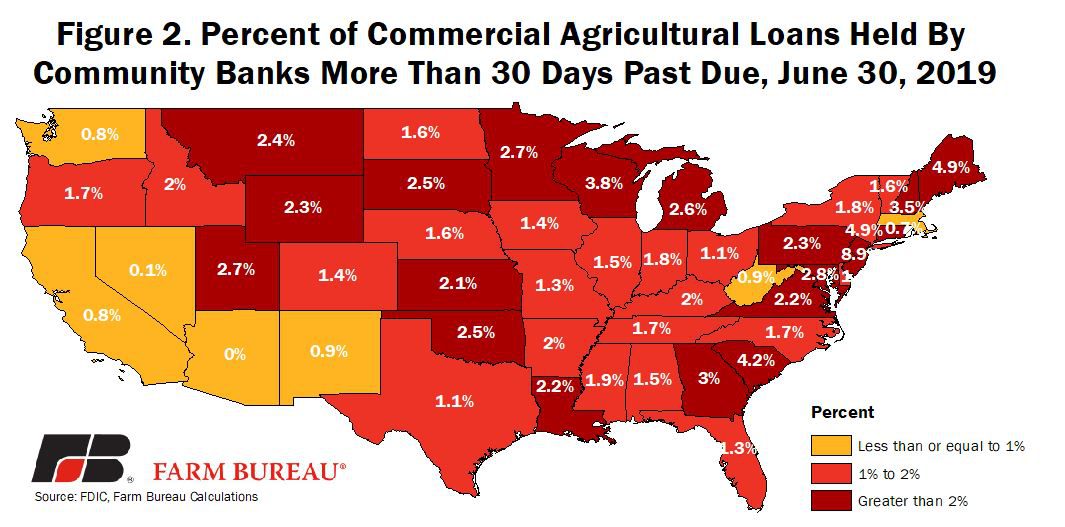
There are two types of commercial lenders that service rural America: community banks and non-community banks. Ranging from below 1% in several Western states to above 2% and 3% in the Great Lakes region and into portions of the East Coast, the average delinquency rate for community bank loans was 1.9%, up from 1.7% last year, Figure 2.
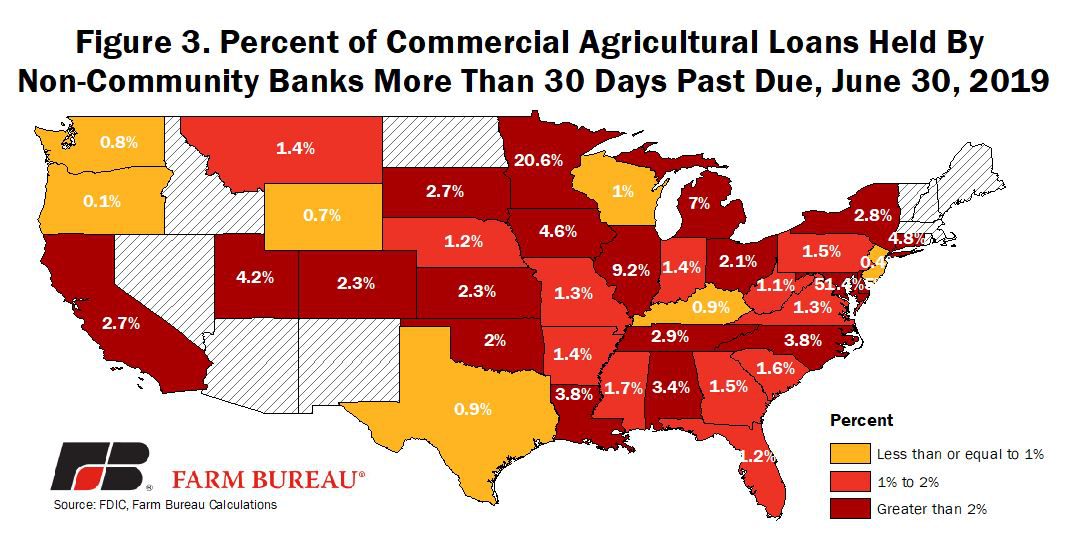
The delinquency rate for non-community banks was higher at 2.5% and was marginally below the 2018 level. Non-community delinquency rates were sharply higher in some portions of farm country. For example, non-community banks in Illinois had an average delinquency rate of 9% on $2.3 billion in agricultural loans, Figure 3. While non-community banks have a smaller footprint in Minnesota, holding $28 million in loans, those servicing the region currently have a delinquency rate of more than 20%. These high delinquency rates highlight how much financial conditions can vary in U.S. agriculture and illustrate the tough financial position of many farm families.
Some of these farm families sought Chapter 12 farm bankruptcy. Over the last 12 months farm bankruptcies have increased 13%, and are at decade-high levels in some portions of the country (Farm Loan Delinquencies and Bankruptcies Are Rising).
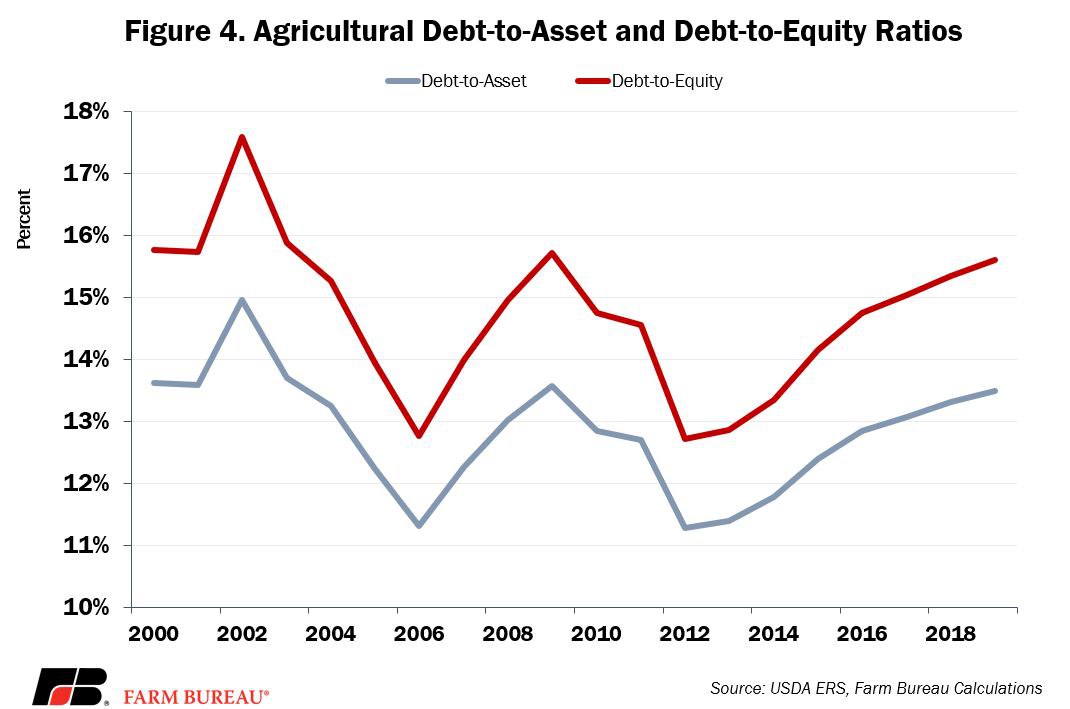
Other indicators of farm financial performance are also moving in the wrong direction. Farm debt is at a record-high $415 billion, and both the debt-to-asset and the debt-to-equity ratio have climbed for seven consecutive years, Figure 4. The debt-to-asset ratio in 2019 is projected at 13.5%, up from 13.3% last year, and the debt-to-equity ratio is projected at 15.6%, up from 15.4% in 2018. In fact, since 2012, the growth rate of agricultural debt has outpaced the growth rate in agricultural asset values. Farm debt has grown by nearly 40% since 2012, while asset values have climbed only 17%. This imbalance in asset performance relative to debt is another sign of a weakening financial situation.
Where is the Disconnect?
There are a few reasons why USDA’s projections for higher farm income diverge from the on-the-ground perspective. First, this projection is a calendar year measure, meaning it includes the sale of crops and livestock that have yet to be harvested and sold. Those sales could provide the financial boost many farmers need to pay down some of their debt and meet their immediate financial needs.
Second, the first and second round of trade assistance payments are still being delivered to mailboxes across rural America (USDA Announces Details Behind the New Trade Aid Package). Of the $88 billion in net farm income projected by USDA, $19.5 billion is federal farm support from a variety of programs. These trade assistance, conservation and farm program dollars will be distributed throughout 2019 – and potentially into 2020, depending on when farmers complete their enrollment applications. Insurance indemnities also contribute to farm income, and given the historical delays in plantings and record prevented plantings in 2019, potential crop insurance indemnification and ad hoc disaster support could be significant.
Summary
USDA recently updated the forecast for farm profitability in 2019 to $88 billion – the highest level since 2014. Despite the projection for higher farm income, many real-time indicators, such as loan delinquency rates, farm bankruptcies, land values and financial ratios, show signs of stress for U.S. agriculture.
Financial conditions in U.S. agriculture do not align with USDA’s most recent forecast because many farmers have yet to harvest and sell their crops or livestock, and much of the federal support responsible for the increase in farm income has yet to be distributed. Once these things happen, farmers’ and ranchers’ books for 2019 could turn out better than previously expected.
The question then becomes, what happens next? Farmers and ranchers are counting on trade – new and expanded markets -- to help make this rosier financial outlook permanent, instead of the stop-gap solution trade aid will be.
Though farmers and ranchers might end the year on more solid footing than current financial conditions foretell, the trade aid that are likely to get them there are not permanent solutions. Instead, farmers and ranchers are banking on trade, rather than aid, to see them through 2020 and beyond.
Updated 2019 farm income slides are available for download below.
Top Issues
VIEW ALL