New Estimates Reveal Major 2022 Weather Disasters Caused Over $21 Billion in Crop Losses

photo credit: Texas Farm Bureau, Used with Permission
Daniel Munch
Economist
AFBF’s Market Intel team has created a multi-part series highlighting agricultural losses incurred due to weather disasters and the associated disaster assistance programs meant to help mitigate their impacts. Previous articles include: 2020 Disaster Estimations Reveal at Least $3.6 Billion in Uncovered Losses; 2020 Disasters Reveal Gaps in Ad Hoc Aid Legislation; Continuing Resolution Extends Disaster Coverage for Most 2020 and 2021 Losses; Kentucky, Arkansas Tornadoes, Midwest Derecho Renew Calls for Timely Disaster Assistance; 2021 Disaster Estimations Reveal at Least $12.5 Billion in Crop and Forage Losses; and From WHIP+ to ERP: A New Name for 2020-2021 Ad Hoc Disaster Assistance. This Market Intel article updates and summarizes total crop loss estimations across major weather events for 2022.
Weather-associated production risk is an inherent factor in farmers’ and ranchers’ everyday business environment. Through heavy rain, hail, snow, winds and drought, farming families prepare land, plant and harvest knowing their livelihoods are reliant on local weather conditions. In 2022, 18 weather and climate disasters, each with damages exceeding $1 billion struck the U.S. coast-to-coast. The National Oceanic and Atmospheric Administration reported that 2022 surpassed 2021 as the third-costliest disaster year event in history, with an estimated $165 billion in total economic losses behind only 2017’s $346 billion and 2005’s $244 billion. With over 470 lives lost, these disasters will haunt impacted communities for years to come.
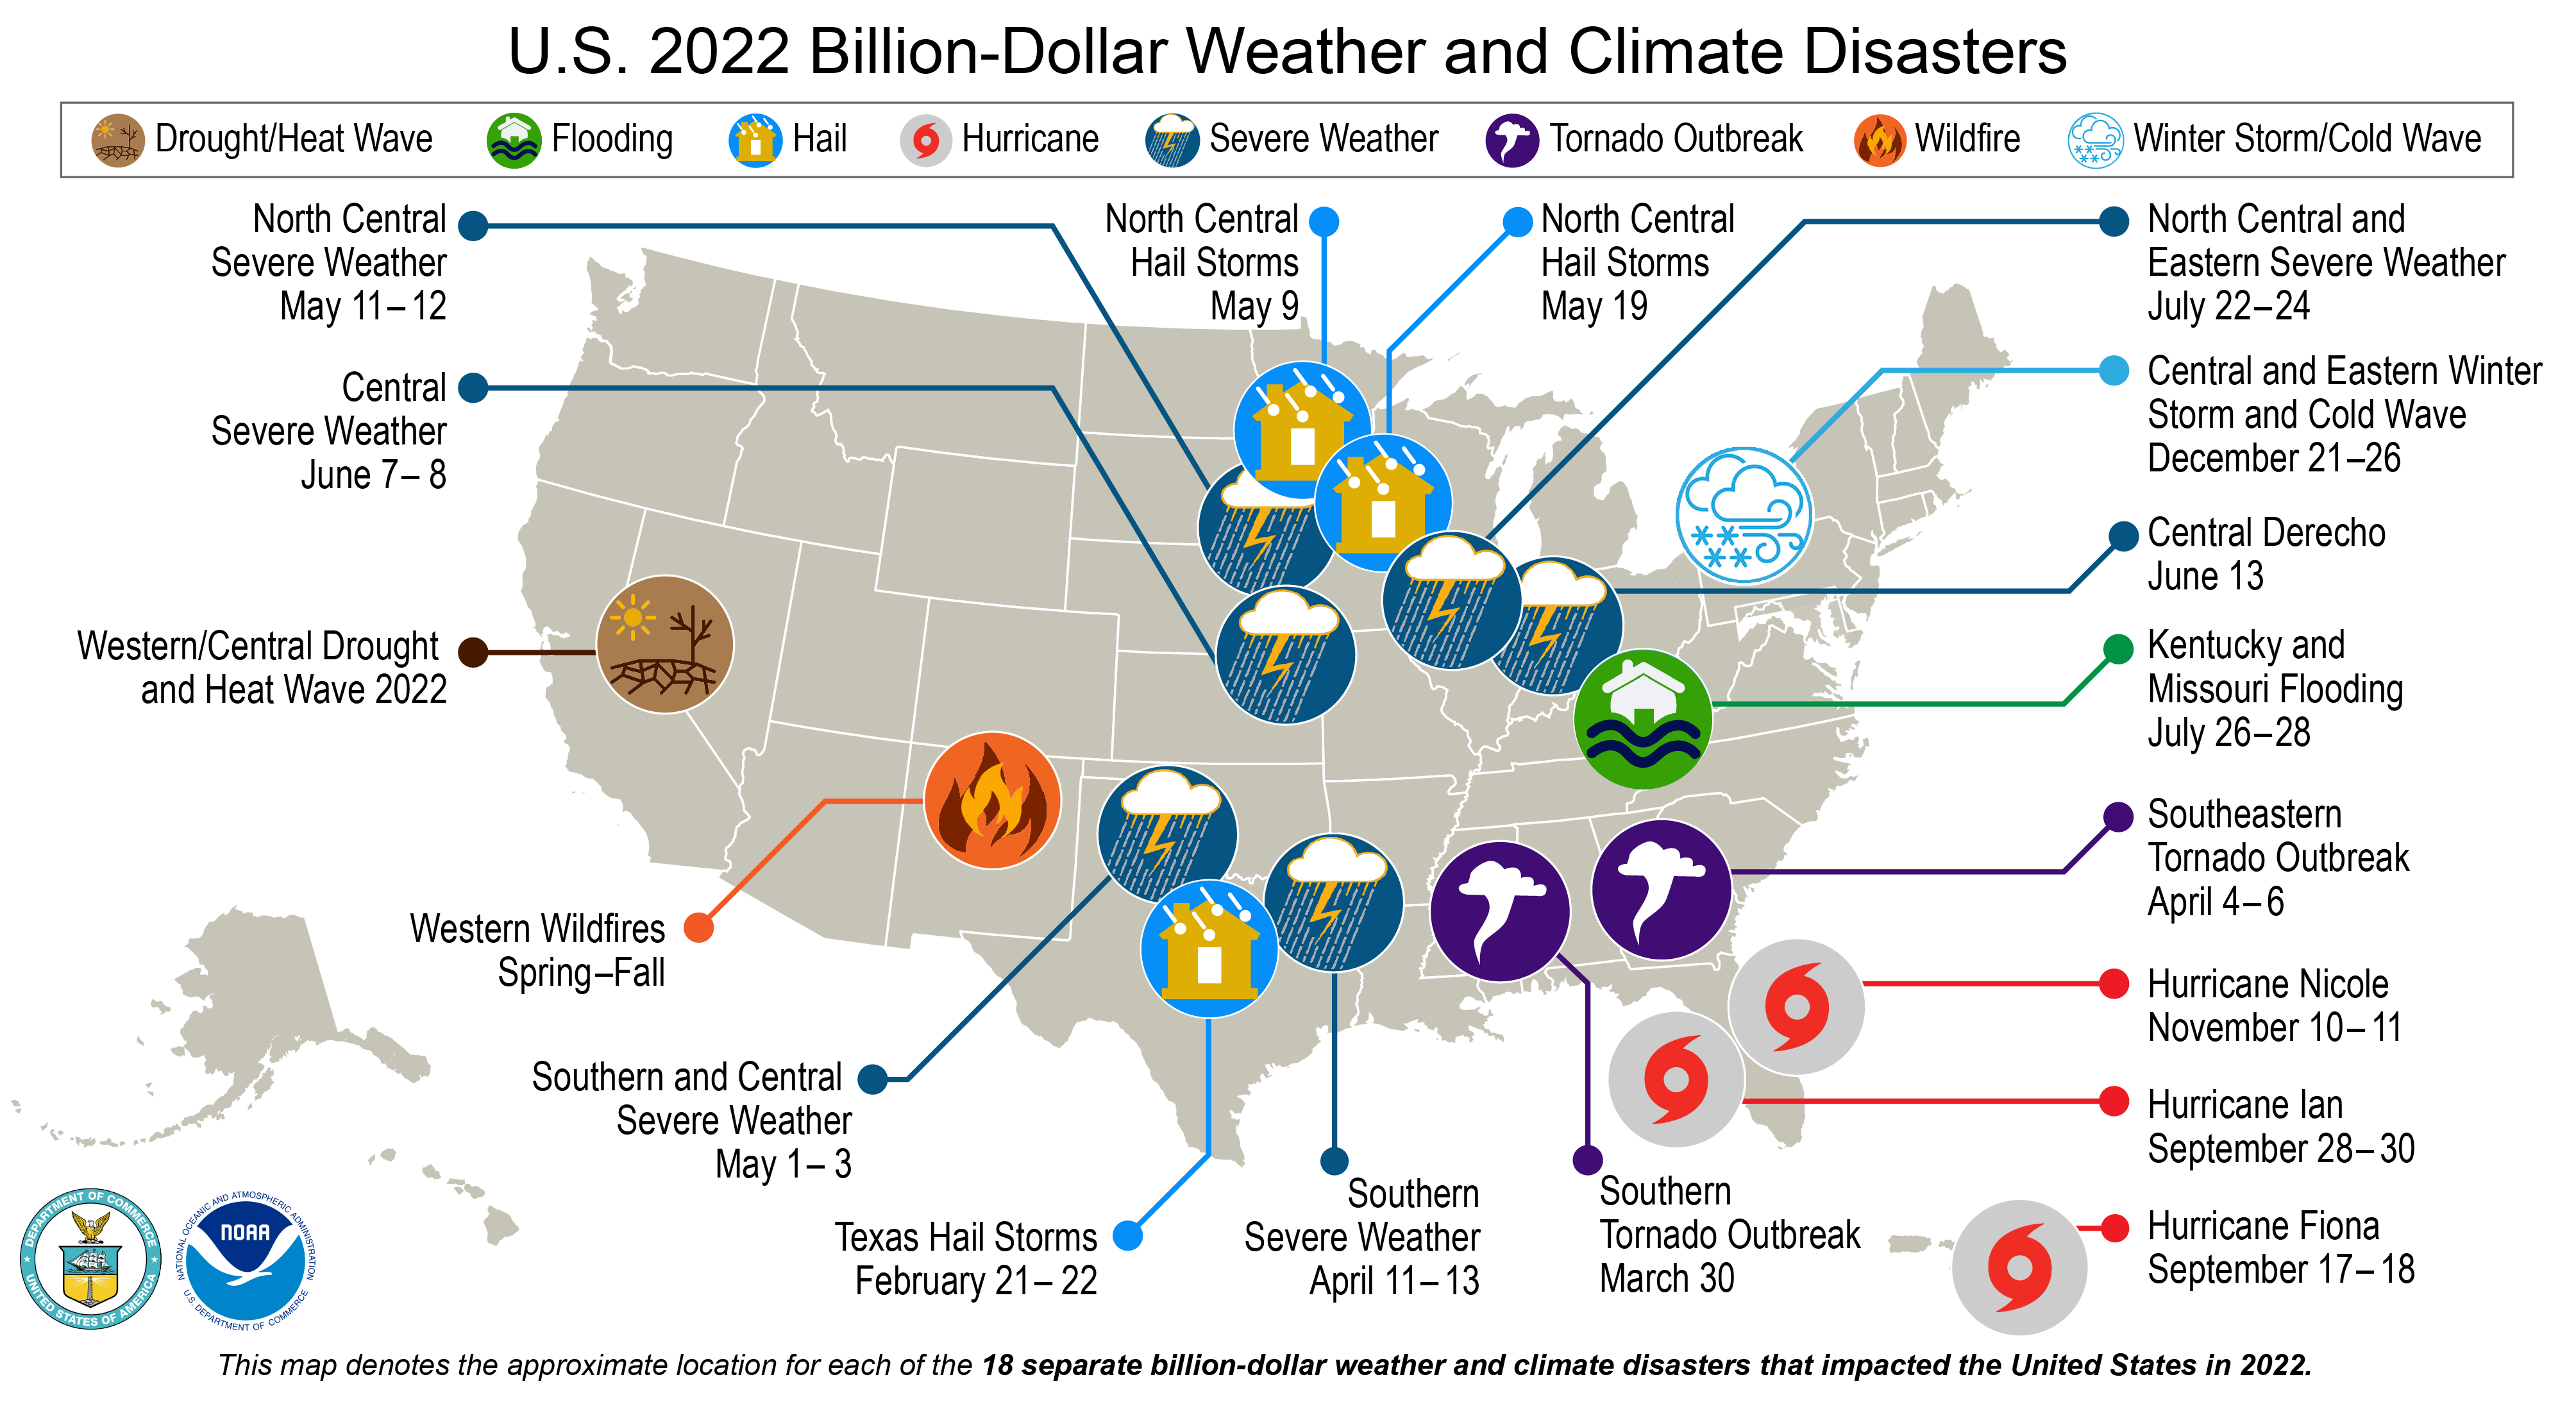
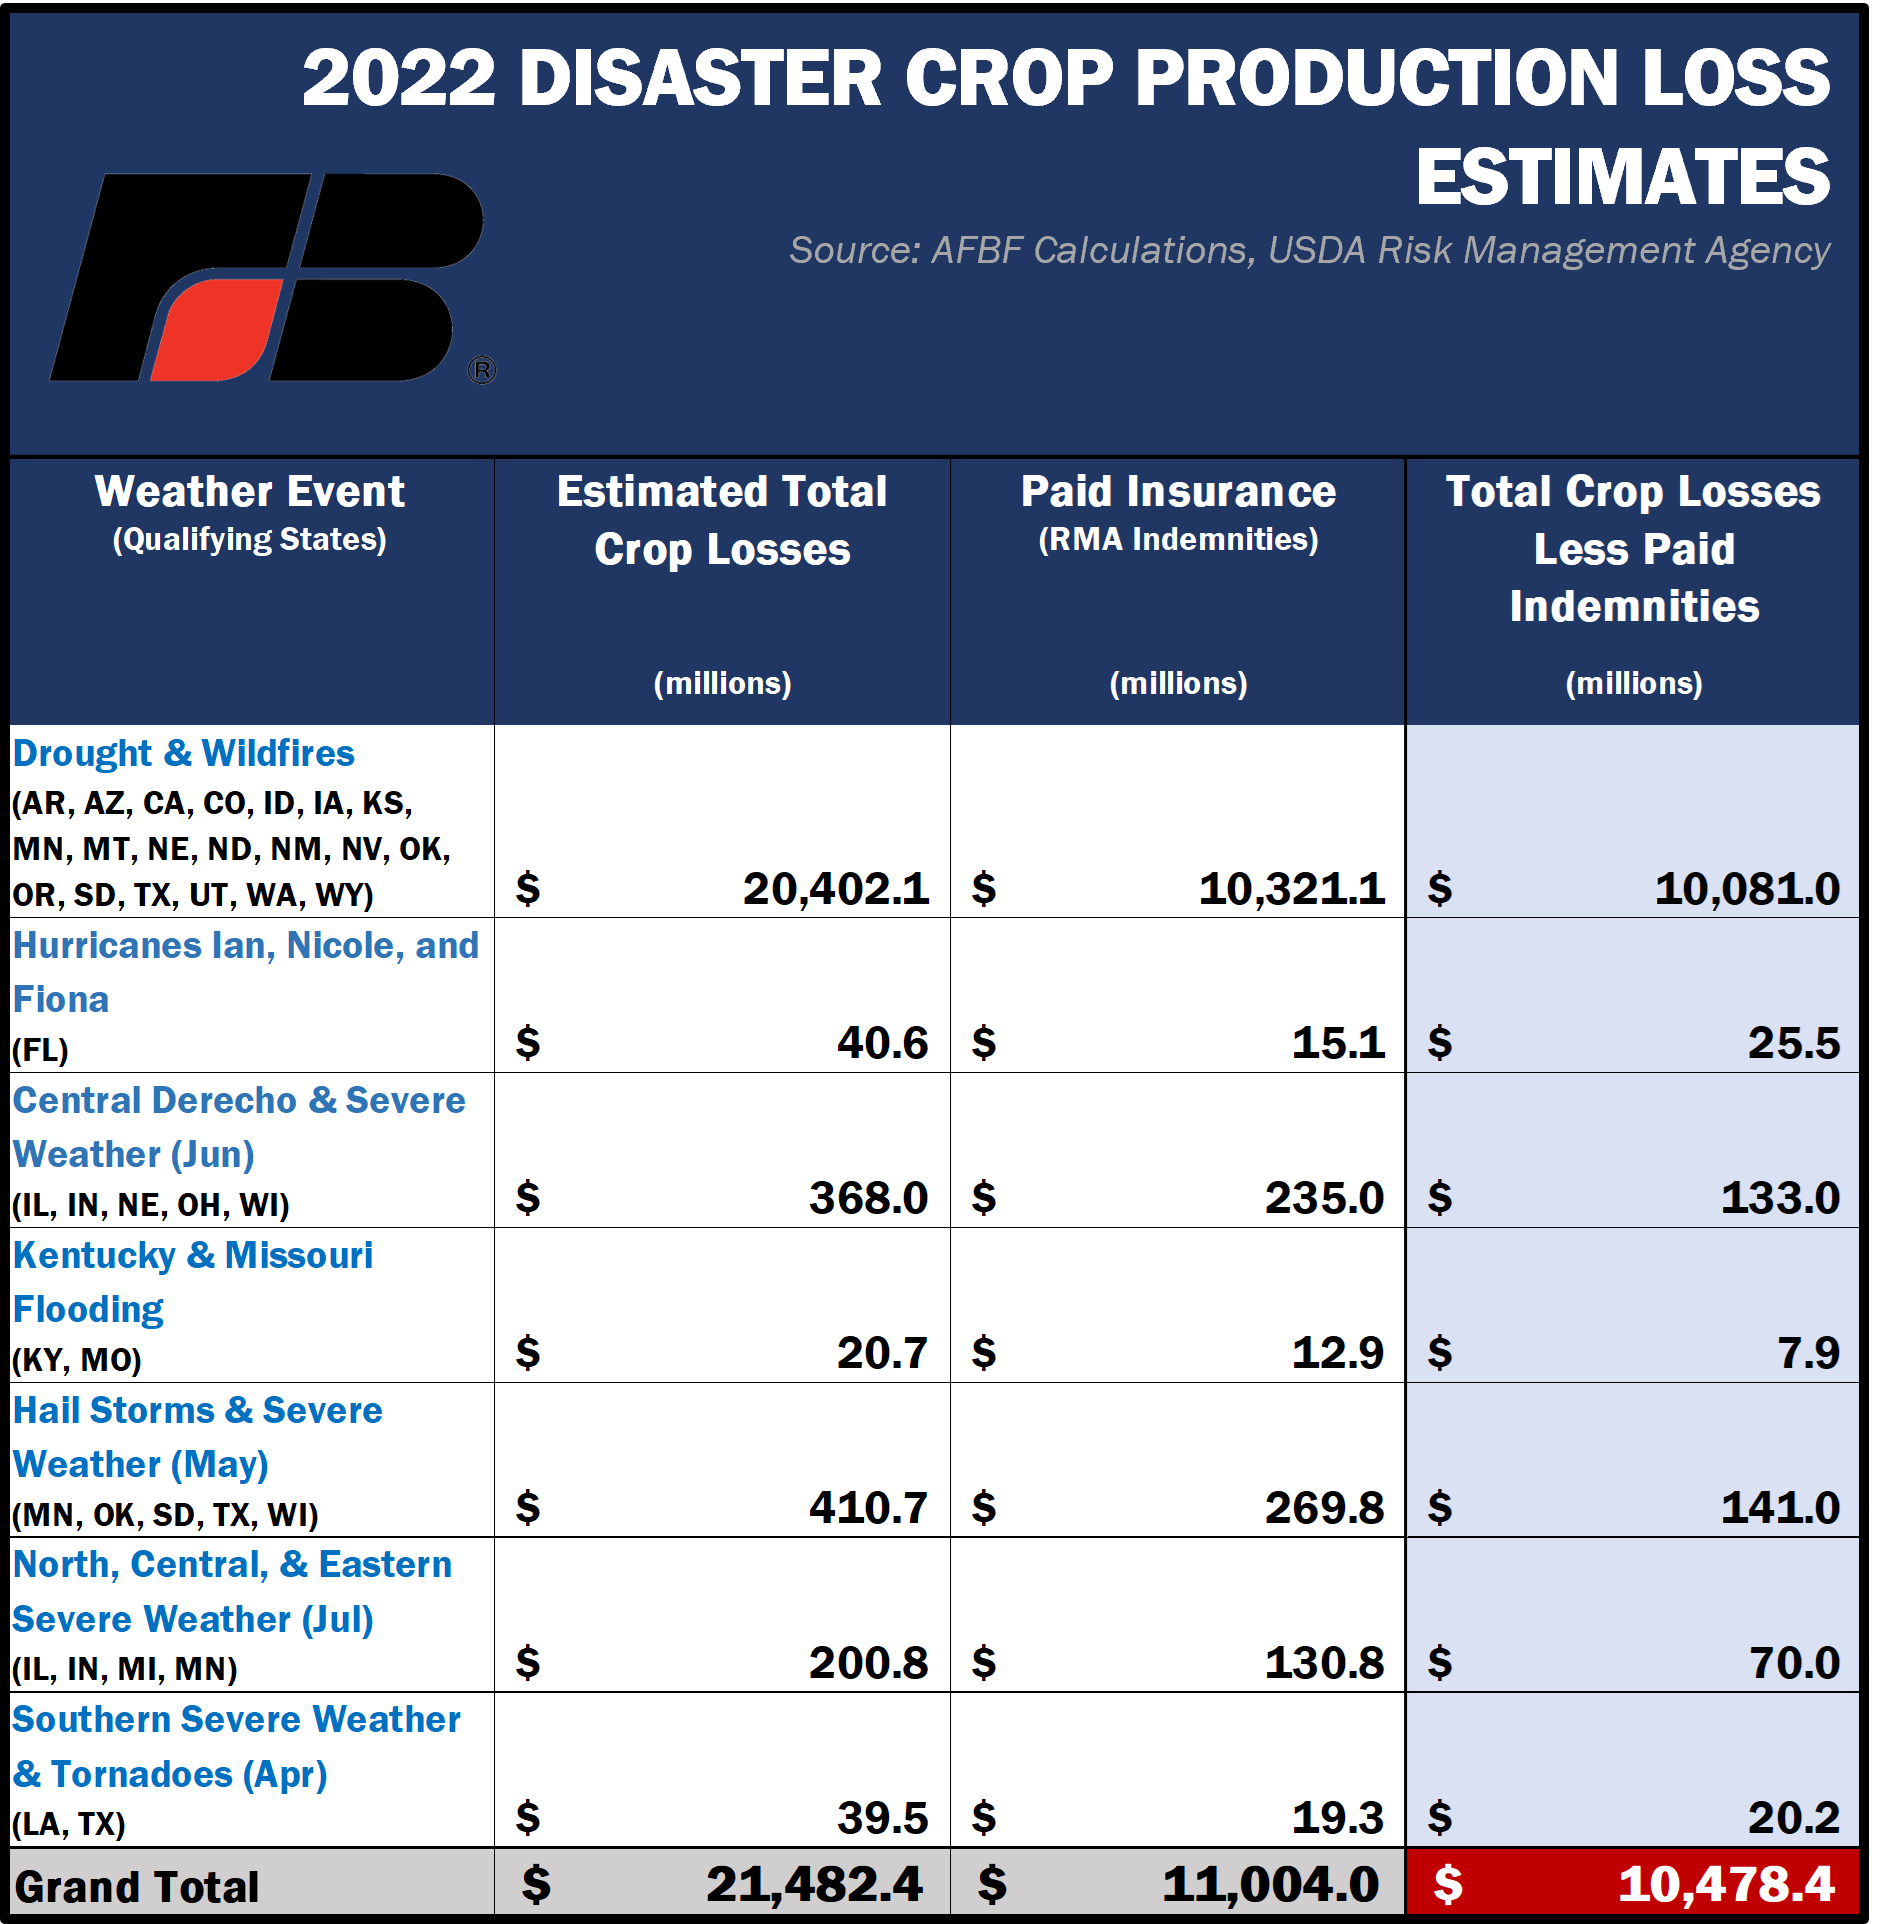
Updated crop and rangeland damage estimations for 2022 provide a window into the recent impacts of natural disasters on domestic food production. The assessment puts total crop and rangeland losses from major 2022 disasters at over $21.4 billion, or 7.7% of NOAA’s total economic impact figure. Of that figure, over $11 billion in losses were covered by existing Risk Management Agency programs as of February 2023. Over $10 billion in losses were not insured through RMA, existed outside policies’ coverage levels, or did not qualify under an existing risk management program. Drought and wildfires alone accounted for over $20.4 billion in total crop losses, with the remaining $1.08 billion linked to hurricanes, hail, flooding and severe weather events as displayed in the data table below.
AFBF crop loss estimates do not include infrastructure damage, livestock losses, horticulture crop losses or timber losses associated with the selected weather events. Estimates should be viewed as a minimum baseline as data to estimate these other categories are not readily available. More comprehensive analysis on individual storms may be available from local land-grant universities. For instance, the University of Florida estimated over $1.03 billion in agricultural losses from Hurricane Ian, a far cry from our estimated $40 million linked to more granular survey data; this includes comprehensive livestock, greenhouse and more accurate specialty crop baselines that aren’t included in this analysis.
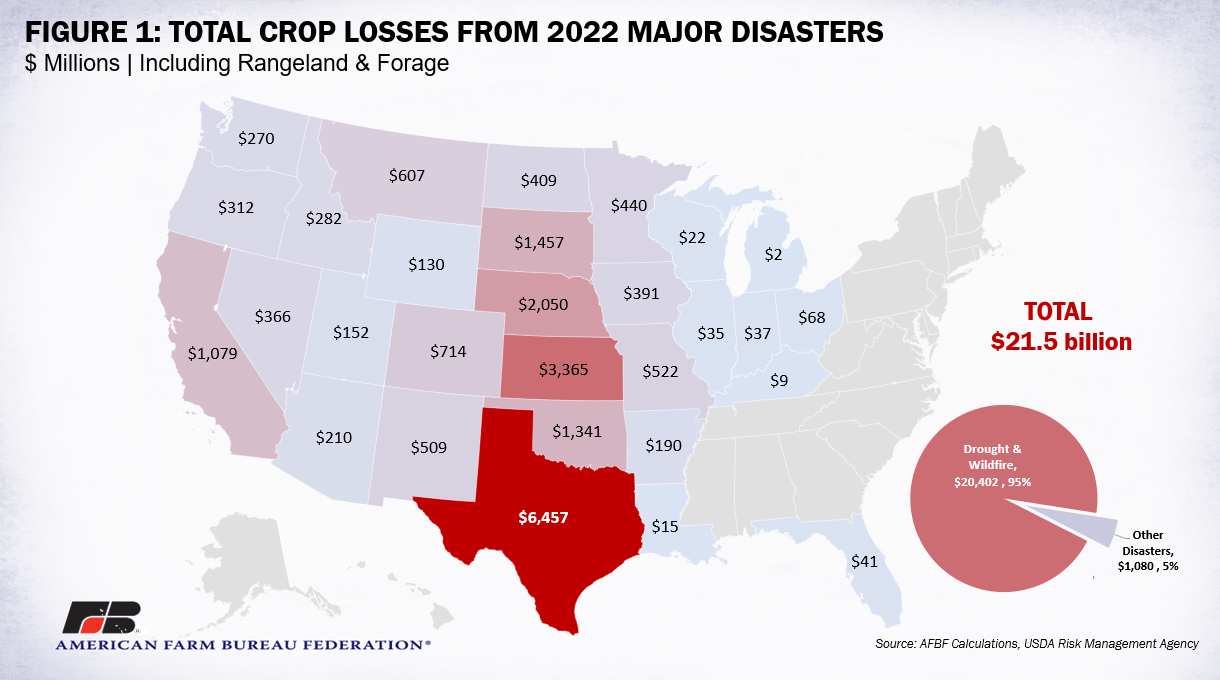
In 2022, Texas suffered the most significant hit, with over $6.4 billion in incurred losses primarily made up of $2.9 billion in damages to cotton, $1.7 billion in damages to forage and rangeland and nearly $1 billion in wheat damage mainly attributed to widespread exceptional drought conditions but also partly linked to May hailstorms and severe weather in April. Kansas ranked second with over $3.3 billion in incurred losses from drought conditions. Kansas corn losses totaled over $1.2 billion followed by $777 million in losses of other grains including crops such as grain and silage sorghum. Soybeans valued at nearly $700 million also succumbed to drought conditions in Kansas. Nebraska’s losses mirrored those of its southern neighbor, with total losses of over $2 billion, $1.8 billion linked to drought including nearly $1 billion in corn and $400 million in soybeans. Nebraska also experienced losses from heavy derecho winds and severe weather in June, which resulted in almost $200 million in corn losses. Moving north again, South Dakota, in fourth place, was also plagued by drought, with over $1.4 billion in total damages, including $660 million in corn losses and $300 million in forage and rangeland losses. In addition, South Dakota experienced hailstorms in May which damaged $130 million in corn.
Rearranging crop loss data points by crop type allows us to pinpoint regional differences in damages associated with different weather conditions. Figure 2 displays overall crop losses by type across all major weather events in 2022. The other grains category includes crops like oats and sorghum, the other oilseeds category includes canola, mustard, flax and the like and the all other category includes miscellaneous crops like tobacco, sugarcane, sugar beets and mint. Seeing forage and rangeland with the most significant losses ($6.3 billion) is not surprising given the correlation between drought and rangeland. Western states are no strangers to arid conditions and vast landscapes often grazed by livestock herds. Reductions in hay stores and abysmal forage conditions forced many farmers and ranchers to liquidate cows early or pay upward of $400/ton for hay shipped across state lines. Importantly, the geographic footprint of extreme drought has shifted between 2021 and 2022, with states in the Pacific Northwest like Washington and Idaho having relatively better conditions, while states like Texas, Kansas and Nebraska have faced widespread drought in the highest, D4 - exceptional, drought category. This has shifted the categories of crops most impacted compared to last year, including a much higher value of corn ($4.5 billion) and cotton ($3.25 billion) lost across the country. Fruit and nut losses were lower but still significant in 2022, largely linked to the different geographic footprint of drought ($400 million in 2022 vs. $1.05 billion in 2021), a primary reason California is not as high on the list as in past years. Read more about the recent impacts of drought on agriculture here.
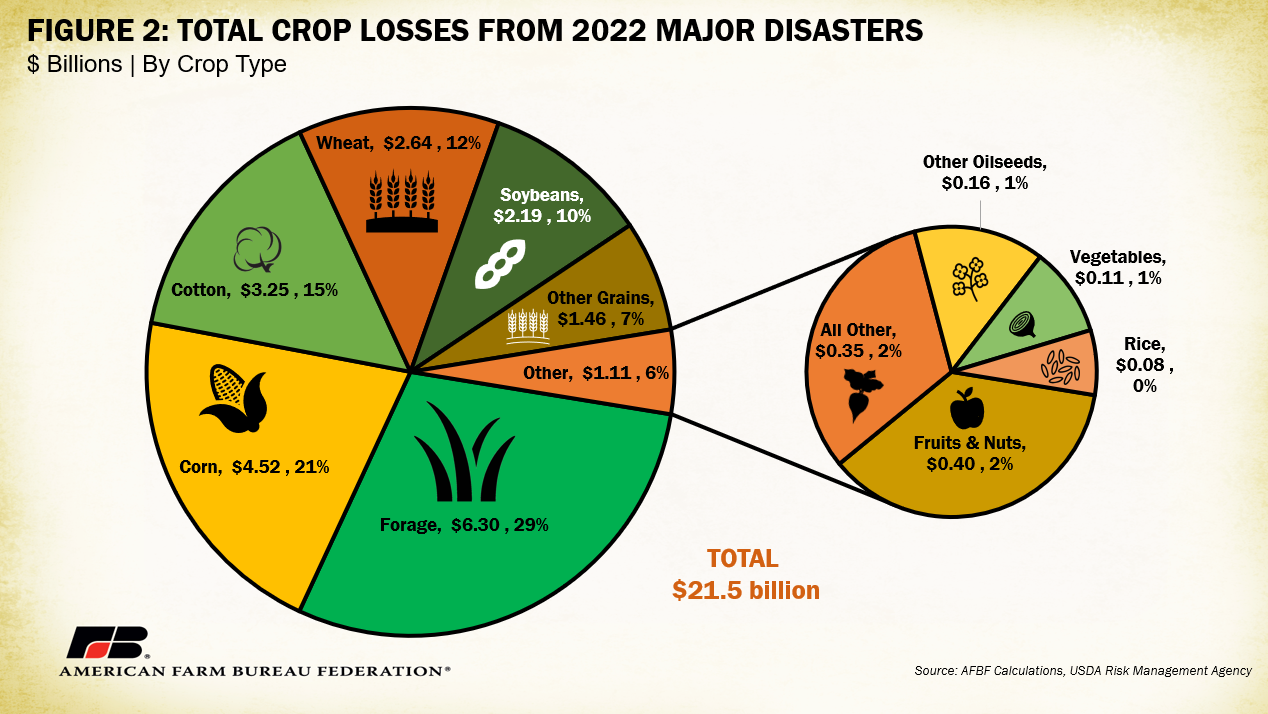
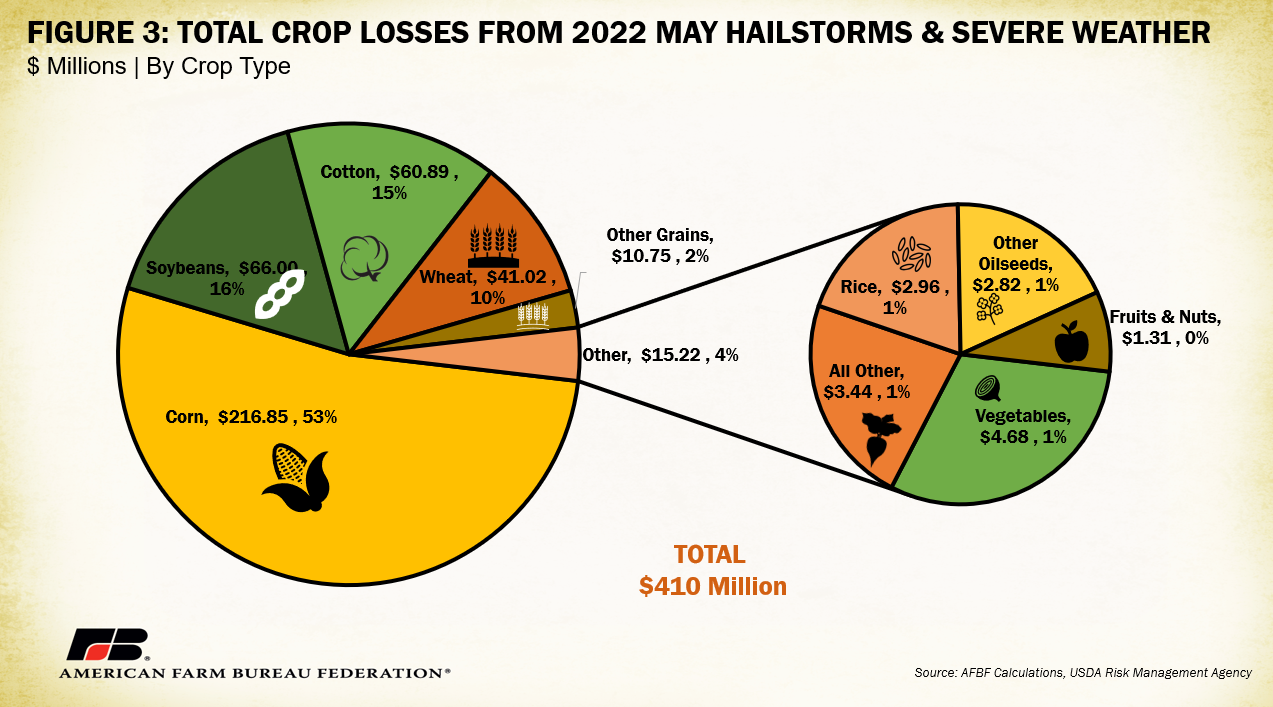
Figure 3 only includes crop losses from May 2022 hailstorms and severe weather, the second-most destructive event after drought. Minnesota, Oklahoma, South Dakota, Texas and Wisconsin faced over $400 million in crop losses from wind, hail and rain damage.
Traditionally, federal crop insurance programs are the preferred mechanism for managing risk associated with weather-related disasters for most agricultural products. These policies provide protection from yield losses, increased costs and revenue declines. Unanticipated disaster situations like large-scale weather events pose the optimal test for these programs, designed to provide targeted risk management under more probable and common loss conditions. Losses that occur outside the scope of these conditions and the specified terms of a policy complicate farmers’ ability to qualify for indemnity payments. For some crops, like strawberries, lettuce and hazelnuts, RMA options are unavailable and other programs, like the Noninsured Crop Disaster Assistance Program, often fall short. A breakdown of relevant specialty crop risk management considerations can be found here.
To fill gaps in existing risk management programs during periods of extreme disasters, Congress has often responded through authorization of ad hoc disaster assistance programs. On May 16, 2022, USDA announced that some commodity and specialty crop producers impacted by natural disasters in 2020 and 2021 would be eligible to receive emergency relief payments to offset crop yield and value losses through Phase 1 of the Farm Service Agency’s new Emergency Relief Program (ERP), previously known as the Wildfire and Hurricane Indemnity Program + (WHIP+). Phase 1 payments were made to farmers who had risk management program enrollment in prior years. Phase 2 opened on Jan. 23 and is meant to support producers who did not participate in existing risk management programs by using tax returns to show a decline in revenues compared to prior years. Thus far, there has been considerable concern surrounding ERP Phase 2 design and execution by both farmers and lawmakers. By the end of February, $7.4 billion in payments had been disbursed under ERP Phase 1 for 2020 and 2021 losses. The $1.7 trillion omnibus spending bill passed last December included an additional $3.74 billion for agricultural disaster losses in 2022. Further discussion of existing farm bill disaster programs and recent ad hoc authorizations can be found here.
Conclusion
Weather and climate-related disasters in 2022 pummeled farms and ranches across the United States, leaving over $21.4 billion in crop and rangeland losses in their wake. Over half of those losses were effectively protected under existing risk management programs with the remainder highlighting the importance of inclusive protections for growers of all crops in all regions of the nation. Not to mention, the full extent of damage across the sector is likely far higher when livestock, infrastructure, timber and other ag-related factors are considered. Already in 2023, farmers and ranchers are experiencing flooding, freezes and persistent drought conditions. The stability of U.S. farms and ranches relies on their ability to be resilient under an array of climate and weather conditions. The 2023 farm bill will give lawmakers a chance to fill gaps in existing risk management programs, providing similar risk management opportunities for farmers regardless of what they grow. The sure and timely payments associated with crop insurance and other farm bill programs is often critical for farm-level stability, and so for a safe and secure domestic food supply.
Methodology
To begin, AFBF economists compiled a list of states impacted by weather events in 2022 that would have qualified for ERP. All D3/D4 droughts, hurricanes, tornadoes and wildfires were included. Affected states were selected using the National Drought Mitigation Center’s U.S. Drought Monitor and the Federal Emergency Management Agency’s presidential disaster list. States that had any form of D3/D4 drought were automatically included in the analysis. States that suffered one or more of the weather events that qualify for ERP and had a presidential-declared disaster were also included in the analysis.
The analysis utilizes RMA crop insurance data to estimate losses if all crop acreage was insured with complete (100%) protection. Methodologies mimic those used by NOAA’s National Climatic Data Center to estimate losses in their annual “Billion Dollar Climate and Weather Disasters” reports (first described in Smith, Katz 2011).
RMA reports on total indemnities (total insurance compensation) paid for each cause of loss (drought, hurricane, flooding, fire, excess moisture, hot wind, etc.) in a given month for each crop type by state. Each storm is defined with a set of cause of loss types based on the weather event and its related conditions covered by ERP. For instance, for hurricanes, the following cause of loss filters were included: excess moisture/precipitation/rain, flooding, hurricane/tropical depression and wind/excess wind. Data was also filtered by the month(s) the storm impacted each state. Once indemnity payments for crops were totaled, adjustments were made for losses outside insured acreage and coverage levels.
This is achieved by first calculating the percent of insured acres in each state (using 2022 data from USDA-National Agricultural Statistics Service and RMA summary of business data). It is assumed all acreage of a given crop has been equally impacted by a particular disaster. Then RMA coverage level data is used to find the average coverage rate for each crop in each state. Based on these stats, a factor approach defined as 1/ [(% acres insured) (average coverage level %)] is utilized to come up with a multiplier to estimate 100% of losses. This was repeated for crops in each affected state and totaled.
Using a real-life example: In Florida, 56% of pepper acreage was insured in 2020. Of the covered pepper acreage in Florida, insurance covered an average of 62% of losses. Following the formula described above, Florida pepper indemnities were multiplied by 1/(0.56*0.62), or 2.88, to estimate 100% of losses.
Additional related loss estimates were calculated using reported indemnities paid out under code 55, or the “ARPI/SCO/STAX/MP/HIP WI Crops Only” RMA cause of loss category. RMA is unable to differentiate the cause of loss for indemnities paid out under code 55, therefore it is assumed all losses to “pasture, rangeland, forage” were due to a qualifying disaster in the month(s) the disaster took place. Pasture, rangeland and forage acreage coverage was calculated using a national Natural Resources Conservation Service private rangeland estimate.

Top Issues
VIEW ALL