Reviewing 2019 County-Level Cash Rents
TOPICS
Land Value
photo credit: AFBF Photo, Morgan Walker
John Newton, Ph.D.
Vice President of Public Policy and Economic Analysis
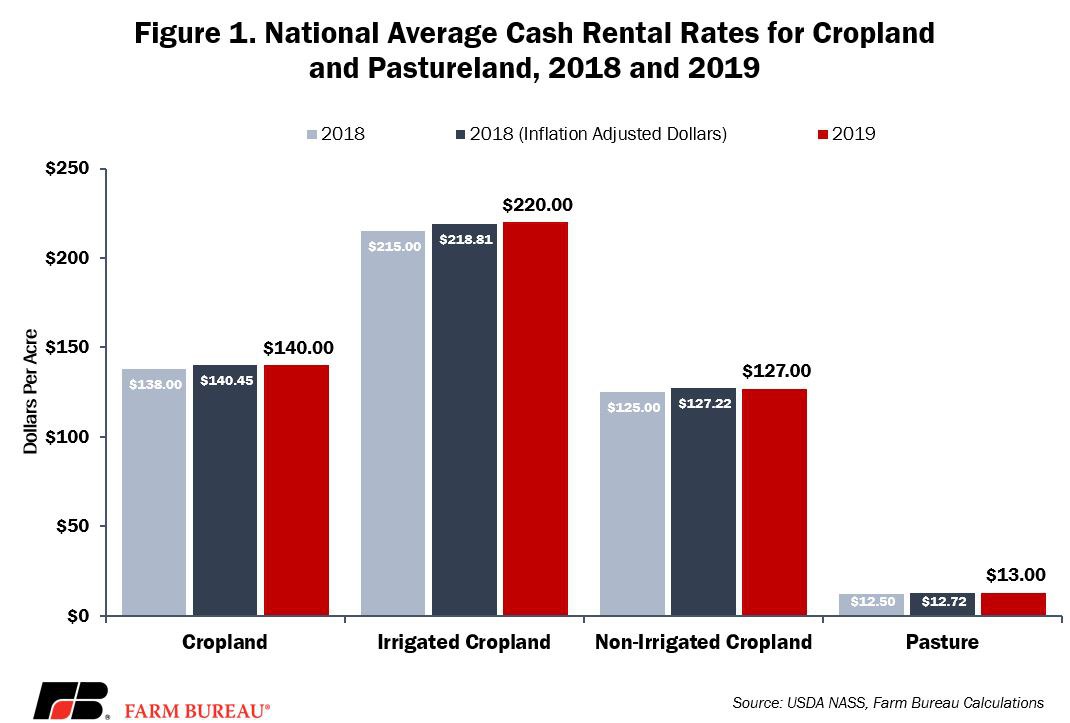
Despite a prolonged downturn in the price of many farm commodities, USDA’s state-level estimates of cash rents for cropland and pasture in 2019 revealed the national average rental rate for all cropland at $140 per acre, up $2 per acre, or 1.4%, from prior-year levels (Land Values and Cash Rents Falling in Some Areas). The average rental rate for irrigated cropland was $220 per acre, up $5 per acre, or 2.3%, from 2018. For non-irrigated cropland, the average rental rate was $127 per acre, up $2 per acre, or 1.6%, from the prior year. Finally, the average rental rate for pasture was $13 an acre, up 50 cents, or 4%, from prior-year levels. In inflation-adjusted dollars, however, only irrigated cropland and pasture rental rates were above prior-year levels; non-irrigated rental rates were outpaced by inflation.
County-Level Rental Rates
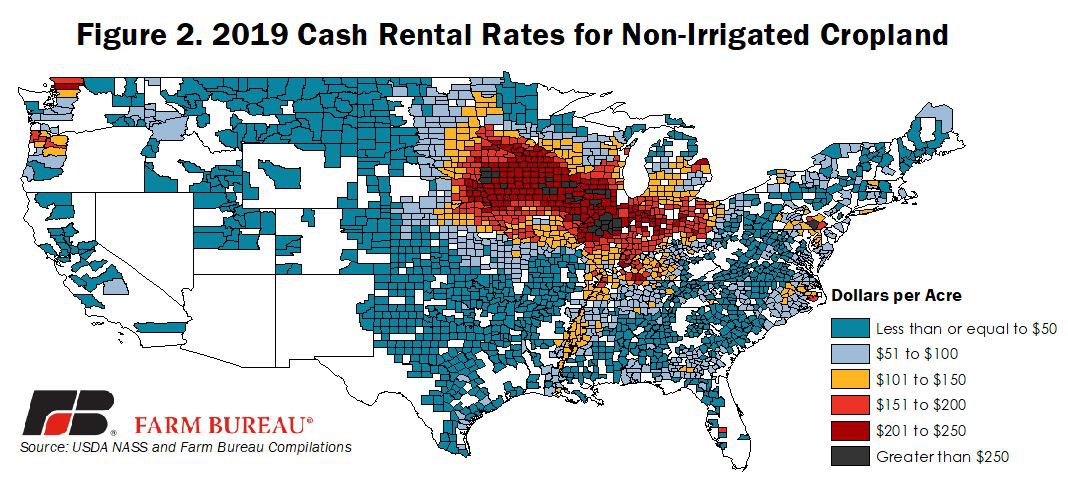
Every other year, USDA’s National Agricultural Statistics Service releases county-level cash rents for non-irrigated and irrigated cropland as well as pasture for all counties with more than 20,000 acres of cropland and pasture. The most recent release, September 2019, showed county-level rental rates for non-irrigated cropland ranging from less than $10 per acre in several Western states to more than $250 per acre across portions of the Corn Belt in Illinois and Iowa. More than 200 counties across the Corn Belt had county average rental rates above $200 per acre, with the highest rental rate, $297 per acre, in Moultrie County, Illinois. Figure 2 highlights 2019 county average rental rates for non-irrigated cropland.
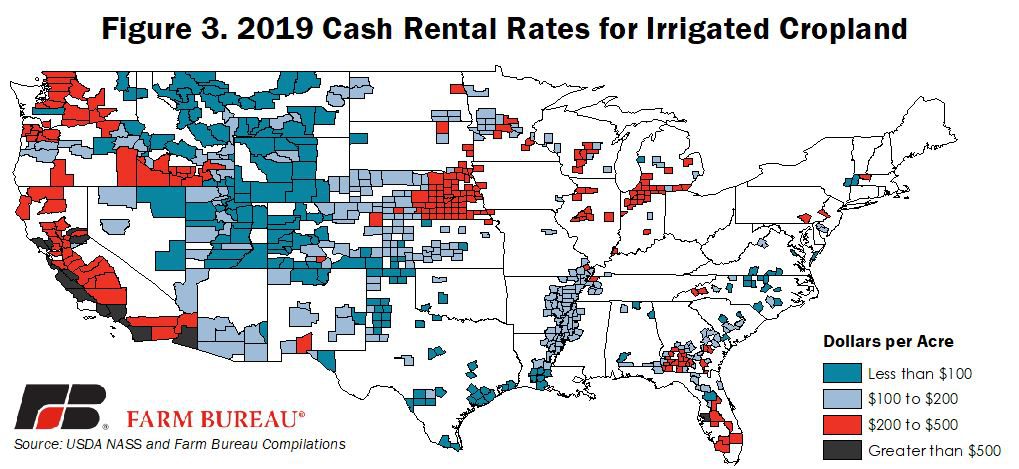
The national average rental rate for irrigated cropland in 2019 was $220 per acre. At the county-level, irrigated rental rates ranged from less than $100 per acre in many Western states, between $100 and $200 per acre in portions of the Southeast, Central Plains and along the Mississippi, to more than $500 per acre in portions of California. Irrigated cropland rental rates were the highest in Ventura County, California, at $2,200 per acre. Moreover, 178 counties had irrigated rental rates at or above the national average. Figure 3 highlights 2019 county average rental rates for irrigated cropland.
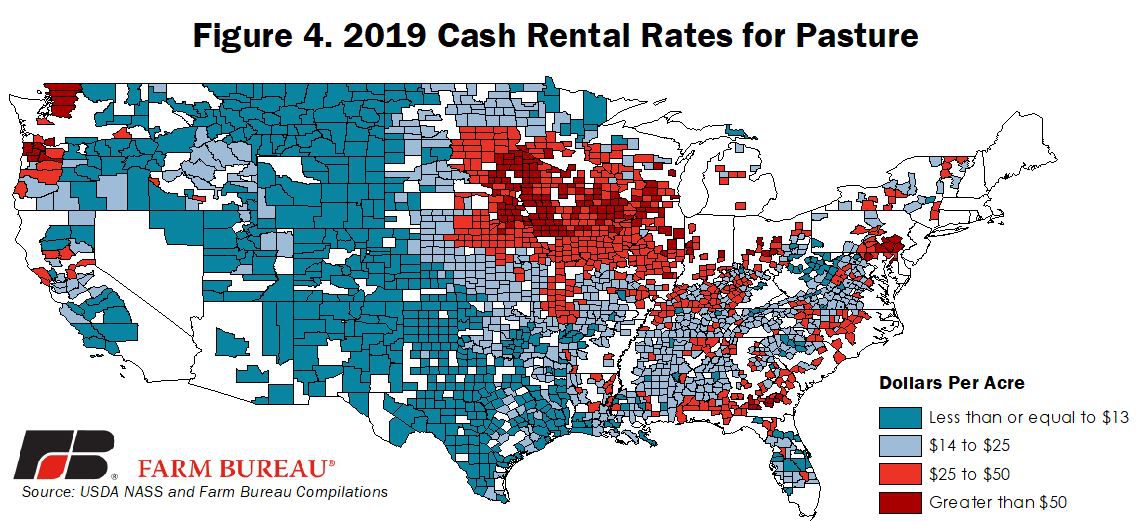
While the national average pasture rental rate was $13 per acre in 2019, many counties had an average pasture rental rate above $13 per acre. Of the 1,870 counties reporting pasture rental rates, 73% had rental rates at or above $13 per acre. Likely due to competition with cropland and livestock density, pasture rental rates were the highest –more than $25 per acre – in portions of the Corn Belt, Minnesota, Wisconsin, Missouri, Nebraska and Kansas. Snohomish County, Washington, had the highest average pasture rental rate, $115 per acre. Figure 4 highlights 2019 county average rental rates for pasture.
Farm Economy and Cash Rents
It’s no secret that the farm economy, i.e., net farm income, has fallen by more than 30% since 2014. Excluding federal support, net farm income has fallen by nearly 40% since 2013 (Is Farm Income Really Up?). Additionally, lower commodity prices have pushed cash receipts from crops down by nearly 20% from their 2012 highs. Lower livestock prices have also resulted in a 16% decline in cash receipts for livestock producers.
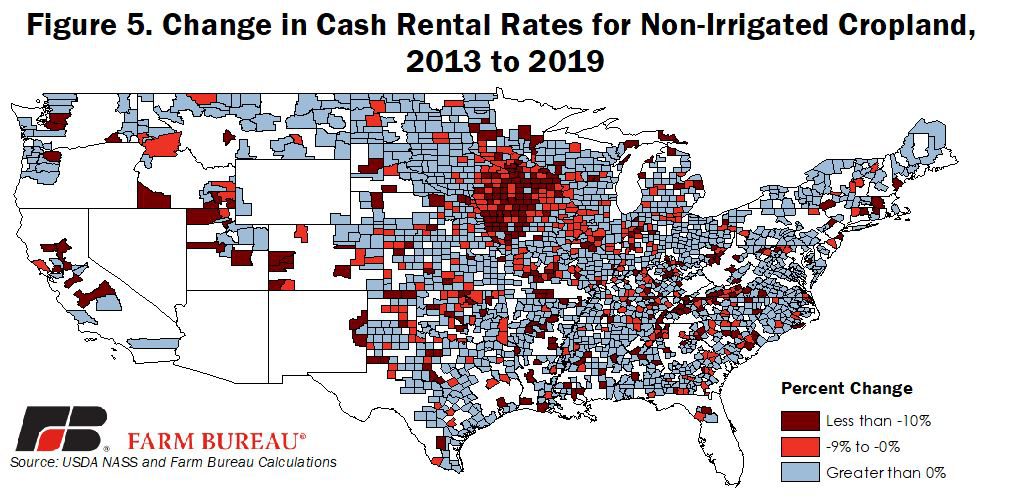
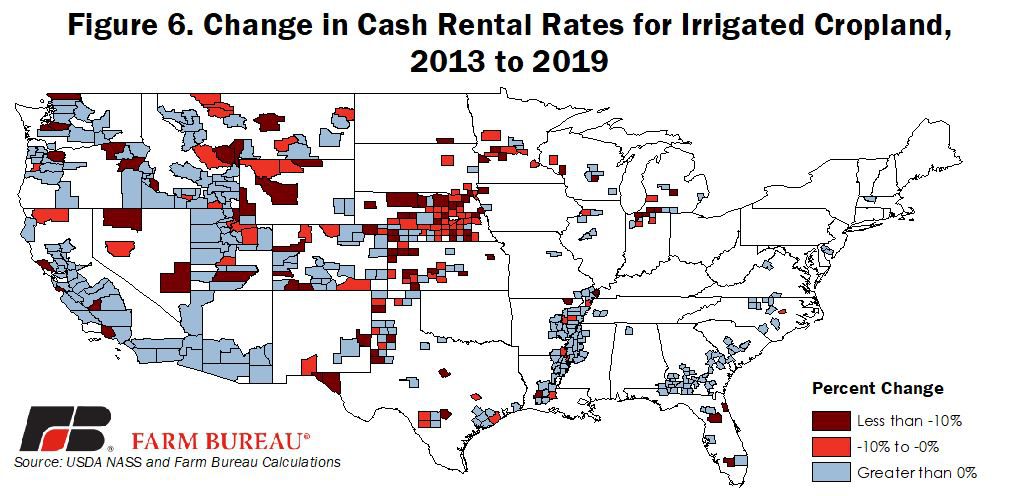
Given the downturn in farm profitability, cash rents were expected to decline, but that’s not been the case nationwide. For non-irrigated cropland cash rents, 67% of counties have higher cash rents today than in 2013. The only area of the country with a high concentration of lower non-irrigated cash rents is in the western Corn Belt, where many counties’ cash rents have declined by at least 10%. Like non-irrigated cropland, irrigated cropland cash rents have increased across many portions of the country. Areas with lower irrigated cash rents mirror areas with lower non-irrigated cash rents in portions of the western Corn Belt.
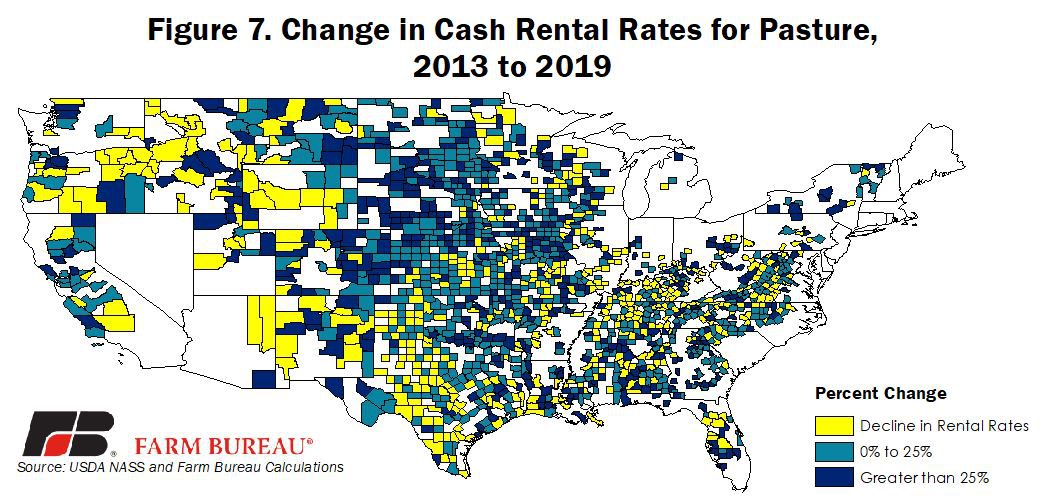
While lower cash rents for cropland were concentrated in the Midwest, across much of the U.S. and even in the Midwest, pasture rental rates have increased substantially. In some cases, cash rents for pasture land have more than doubled. The increase in pasture cash rents can be explained by increases in the beef cattle herd, fewer acres of pastureland (The 2017 Census of Agriculture, Our First Take), and, anecdotally at least, increases in cash rental rates demanded by private and largescale ranchland owners. Figures 5 through 7 highlight the change in cash rents for irrigated and non-irrigated cropland, as well as pasture, from 2013 to 2019.
Summary
USDA recently released updated cash rental rates for cropland and pasture for 2019. Cash rental rates for non-irrigated cropland and pasture are the highest in portions of the Midwest where crop yields are the greatest, while cash rental rates for irrigated cropland are the highest in areas with higher concentrations of specialty crops. Outside of portions of the Midwest, most cropland rental rates have increased, despite the downturn in the farm economy.
Given current expectations for farm income to rise in 2019 due to federal assistance, an anticipated inflation level of 2% and lower interest rates, the demand for agricultural land, i.e., cropland or pasture for rent, is likely to remain competitive going into 2020. The demand would likely be enhanced by welcome news on the trade front, including but not limited to the U.S.-Japan agricultural agreement, the passage of USMCA, and a resolution of normalized – and fair – trade with China.
Top Issues
VIEW ALL