U.S. Tariffs in the Global Landscape
TOPICS
TradeMegan Nelson
Economic Analyst

photo credit: Getty Images
Megan Nelson
Economic Analyst
Information regarding tariff rates and talk of trade wars have been pouring into the media cycle lately. With agriculture at the tip of the spear in this war, it is important to understand the complex trade policy decisions being made. This article is the first in a weekly series that will profile different commodities and the tariffs they face.
Figure 1 illustrates the comparison between gross domestic product per capita and the average tariff a country charges incoming agricultural products. The United States has an estimated $59,500 GDP per capita and an average most favored nation tariff rate of 5.2 percent for agricultural products. MFN tariffs are what countries promise to impose on imports from other members of the World Trade Organization unless the country is part of a preferential trade agreement (such as a free trade area or customs union).
In contrast, countries with a substantially lower GDP per capita, like India and Ghana, have a higher MFN tariff of 32.7 percent and 20.2 percent, respectively. One of our largest trading partners, China, maintains an average tariff on agricultural products of 15.2 percent. Another of our largest trading partners, the European Union, charges an average of 11.1 percent on agricultural products.
Canada and Mexico, our counterparts in the North American Free Trade Agreement, currently charge average MFN tariffs of 15.6 percent and 14.6 percent, respectively, on agricultural products from WTO members who are not free trade agreement partners. However, because of NAFTA, the preferential average tariff on U.S. agricultural products into Canada and Mexico is 6.9 percent and 0 percent, respectively.
Healthy trade relationships based on reciprocal exchange build countries. Maintaining these relationships not only strengthens the global economy but also boosts the welfare of every American.
.jpg)
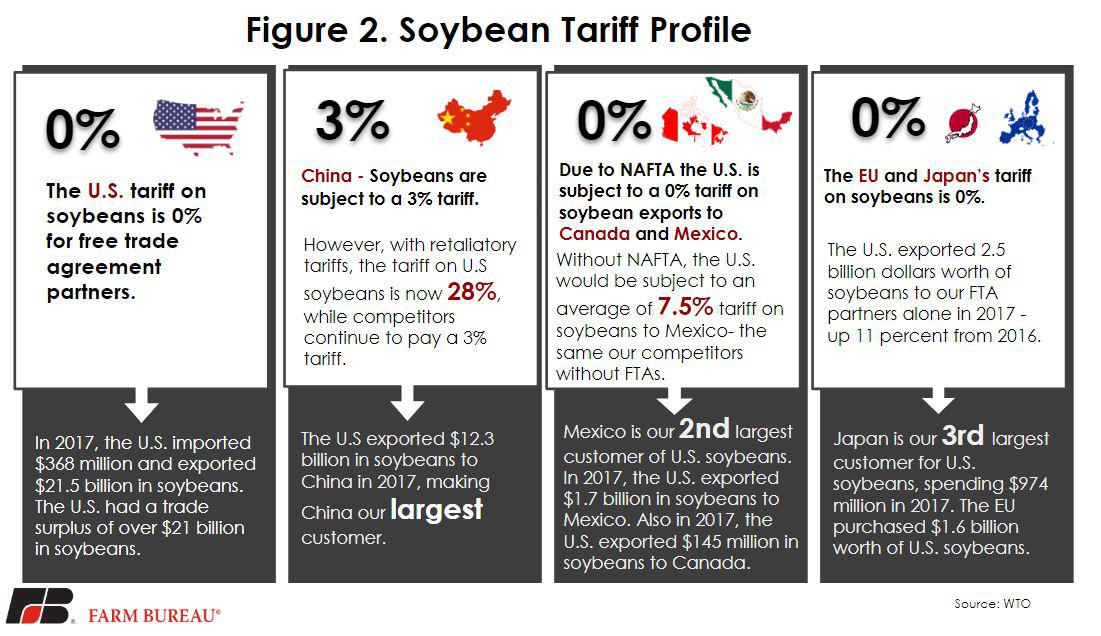
In 2017, the U.S. imported $368 million worth of soybeans, charging a 0percent tariff, and exported $21.5 billion worth of soybeans. The net trade balance on U.S. soybeans equates to over a $21 billion surplus.
Buying over 60 percent of the world’s production last year, China is the world’s largest importer of soybeans and the U.S.’s largest customer. The current tariff China charges on soybeans is 3 percent. However, with retaliatory tariffs of 25 percent, the U.S. is now charged 28 percent.
Free trade agreements like NAFTA encourage trade between nations by lowering the tariff on soybeans to 0 percent. Mexico is our second-largest soybean customer and charges the agreed-upon 0 percent tariff, instead of their average tariff of 7.5 percent on soybeans. Free trade agreements continue to boost trade by lowering barriers between nations. In 2017, the U.S. exported $2.5 billion worth of soybeans to FTA partners, up 11 percent from 2016. Figure 2. takes a closer look at soybean tariffs.
Top Issues
VIEW ALL