Updated Outlook for the U.S. Farm Economy
TOPICS
Market Intel
photo credit: Right Eye Digital, Used with Permission
John Newton, Ph.D.
Vice President of Public Policy and Economic Analysis
Farm Income Projected to be Higher Than Anticipated
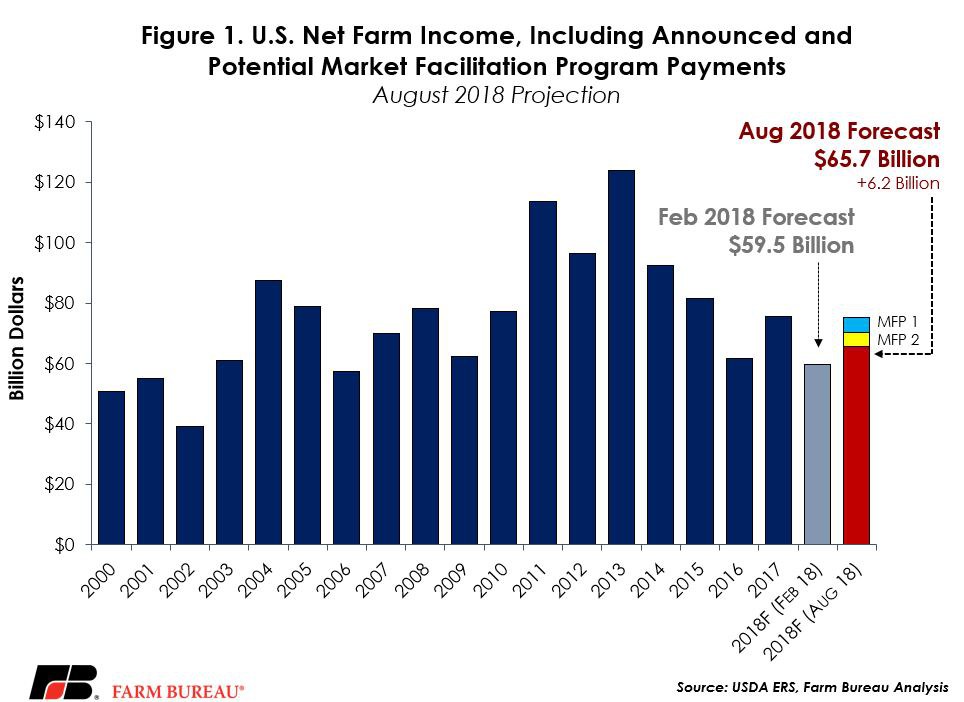
Prior to USDA’s August 2018 Farm Income Forecast, net farm income, a broad measure of farm profitability, was projected in 2018 to be at the lowest level in more than a decade at $59.5 billion. This forecast, published in February, represented a drop in farm income of more than 50 percent, or $64 billion, from 2013’s high. It would have been the largest ever five-year decline in farm income.
Now, following USDA’s August update, net farm income is projected at $65.7 billion—the third-lowest level over the last decade, behind 2016 and 2009. While net farm income is still projected to be 13 percent lower than 2017 levels, it is no longer expected to sink to decade-low levels. Instead, higher projections of gross farm income more than offset higher gross expenses.
Net farm income is watched so closely because it is a comprehensive indicator of U.S. farm profitability – for all crops and livestock – and includes cash receipts from farming as well as farm-related income, including government payments and noncash items like changes in inventories, economic depreciation and gross imputed rental income, minus cash expenses.
These most recent projections for net farm income do not include the recently announced market facilitation program payments of $4.7 billion to $9.4 billion (Trade Aid Round One: A State Perspective). When including these program payments, net farm income rises to $75 billion and would be in line with the 2017 net farm income level.
If the August projections of net farm income are realized, and all $9.4 billion in trade-related market facilitation program payments are delivered, 2018 net farm income would remain approximately 39 percent, or $49 billion, below 2013’s record-high and 12 percent below the 10-year average of $85 billion. If only half of the market facilitation program payments are delivered, net farm income would be 43 percent, or $53 billion, below 2013 levels. Figure 1 highlights the February and August net farm income projections as well as program payments from the market facilitation program.
Farm Debt and Debt-to-Asset Ratios Climb
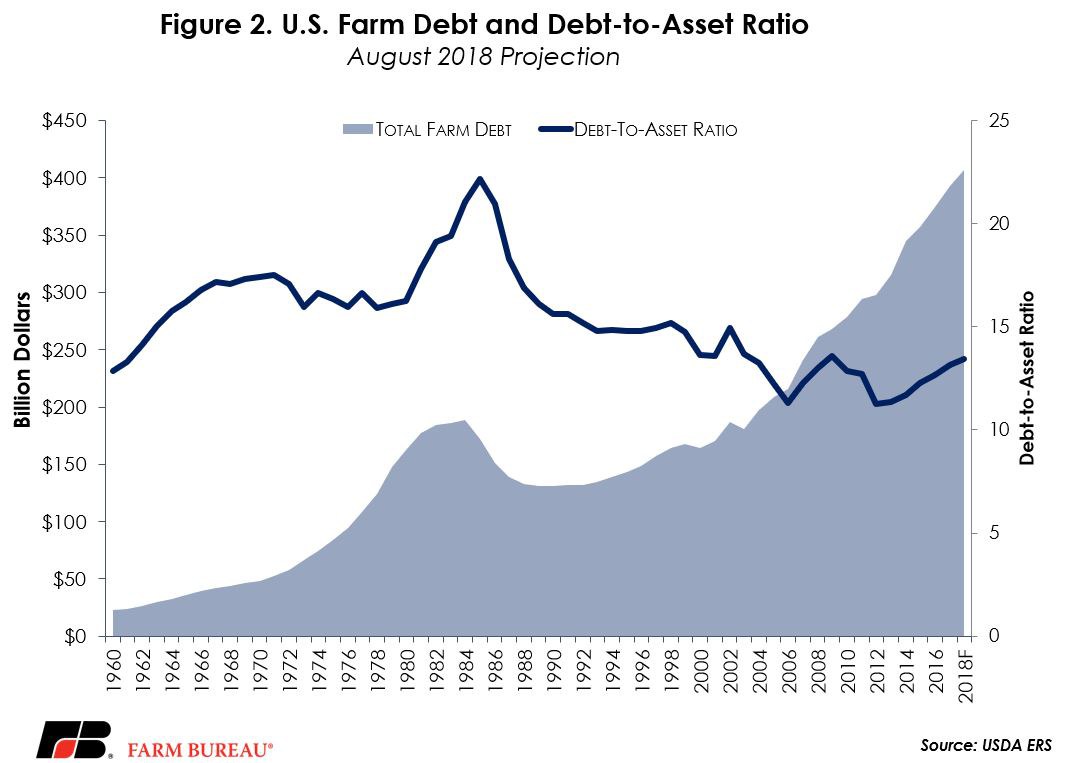
While the outlook for farm income improved, the outlook on farm debt worsened. USDA’s February forecast projected total farm debt in 2018 at a record $389 billion. Now, total farm debt is projected at a record $406.9 billion, up sharply from the February projection and up 3 percent, or $13.8 billion, from 2017 levels.
One important indicator of the financial health of the farm economy is the debt-to-asset ratio. In February, USDA had projected the debt-to-asset ratio to fall to 12.6 percent in 2018. However, now USDA projects the debt-to-asset ratio to climb in 2018 to 13.4 percent – the highest level since 2009 and the sixth consecutive year of climbing debt-to-asset ratios. Figure 2 highlights farm debt and debt-to-asset ratio projections.
In addition to climbing debt and debt-to-asset ratios, the debt-service ratio, which measures the proportion of farm production needed to service debt, is projected to increase to 27.8 percent – the highest level in 30 years. The current ratio, which measures the ability of agriculture to pay short- and long-term debt, i.e., assets divided by liabilities, is projected at 1.44, the lowest level since the series was first recorded in 2009. While farm assets remain greater than total liabilities, a rapidly declining working capital ratio suggest some farms may be unable to service debt and accounts payable with existing assets.
Inflation-Adjusted Farm Economy Indicators
In 2018 inflation-adjusted dollars, net farm income is projected to be 14.8 percent, or $11.4 billion, below prior-year levels. If realized, this inflation-adjusted net farm income would be the fourth-lowest over the last three decades – behind only 2002, 1995 and 2016. This does not include the market facilitation program payments.
Net cash farm income is less comprehensive and does not include noncash items. Net cash income in 2018 is projected at $91.5 billion, down 12 percent and $12 billion from 2017 levels. If realized, this would be the lowest level since 2009’s $74 billion. In 2018 inflation-adjusted dollars, net cash income is projected to be 14 percent, or $14.6 billion, lower than in 2017 – and again the lowest level since 2009.
After adjusting for inflation, the 2018 projection for farm debt is the highest in over 30 years, when farm debt was $412.6 billion in 1982. At that time however, the debt-to-asset ratio was 19.1 percent – much higher than the 13.4 percent projected for 2018. Figure 3 highlights inflation-adjusted net farm income, net cash income and total farm debt.

Implications
While the current outlook for U.S. net farm income is more optimistic than the February 2018 projection, farm income remains below prior-year levels and below the 10-year average. The one-time, trade-related market facilitation program payments will boost farm income in 2018 and help farmers service debt and other obligations. However, these are expected to be one-time payments and as a result farmers and ranchers need more market and financial certainty post-2018.
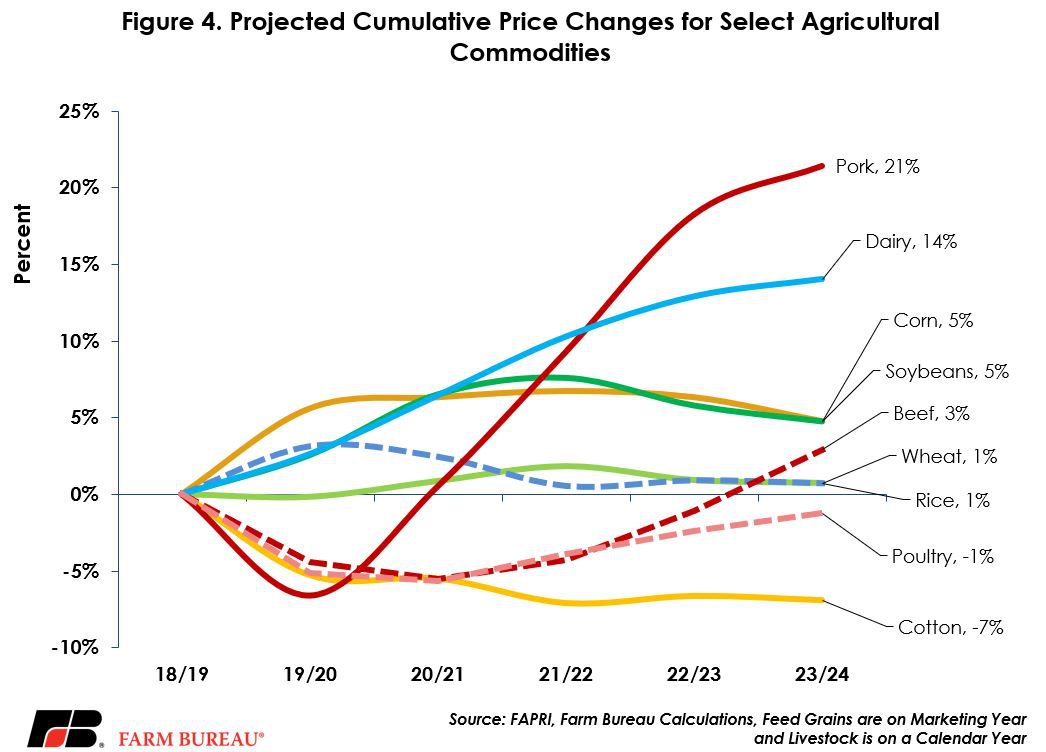
The University of Missouri Food and Agricultural Policy Research Institute’s August 2018 baseline projects beef, cotton, pork and poultry prices will face downward pressure in the coming years. Corn, dairy and soybeans are expected to experience higher prices while wheat and rice prices are expected to remain flat. These price changes in major crops are accompanied by expectations for acreage reallocations out of soybeans due to declining export sales over the next five years. For livestock, competition in the meat case and tariffs will put pressure on prices until supplies adjust.
The uncertain financial outlook in for the next few years, climbing debt and debt-to-asset ratios, as well as expectations for higher interest rates, highlight the need to complete the farm bill on time, prove the U.S. is a reliable and consistent supplier in export markets, get meaningful farm labor reform and continue reducing regulatory burdens on farmers and ranchers. The policy goals will go a long way toward improving the outlook for U.S. agriculture.
Top Issues
VIEW ALL