Competing Across the Calendar: The Growing Squeeze on U.S. Produce

Daniel Munch
Former AFBF Economist
Key Takeaways
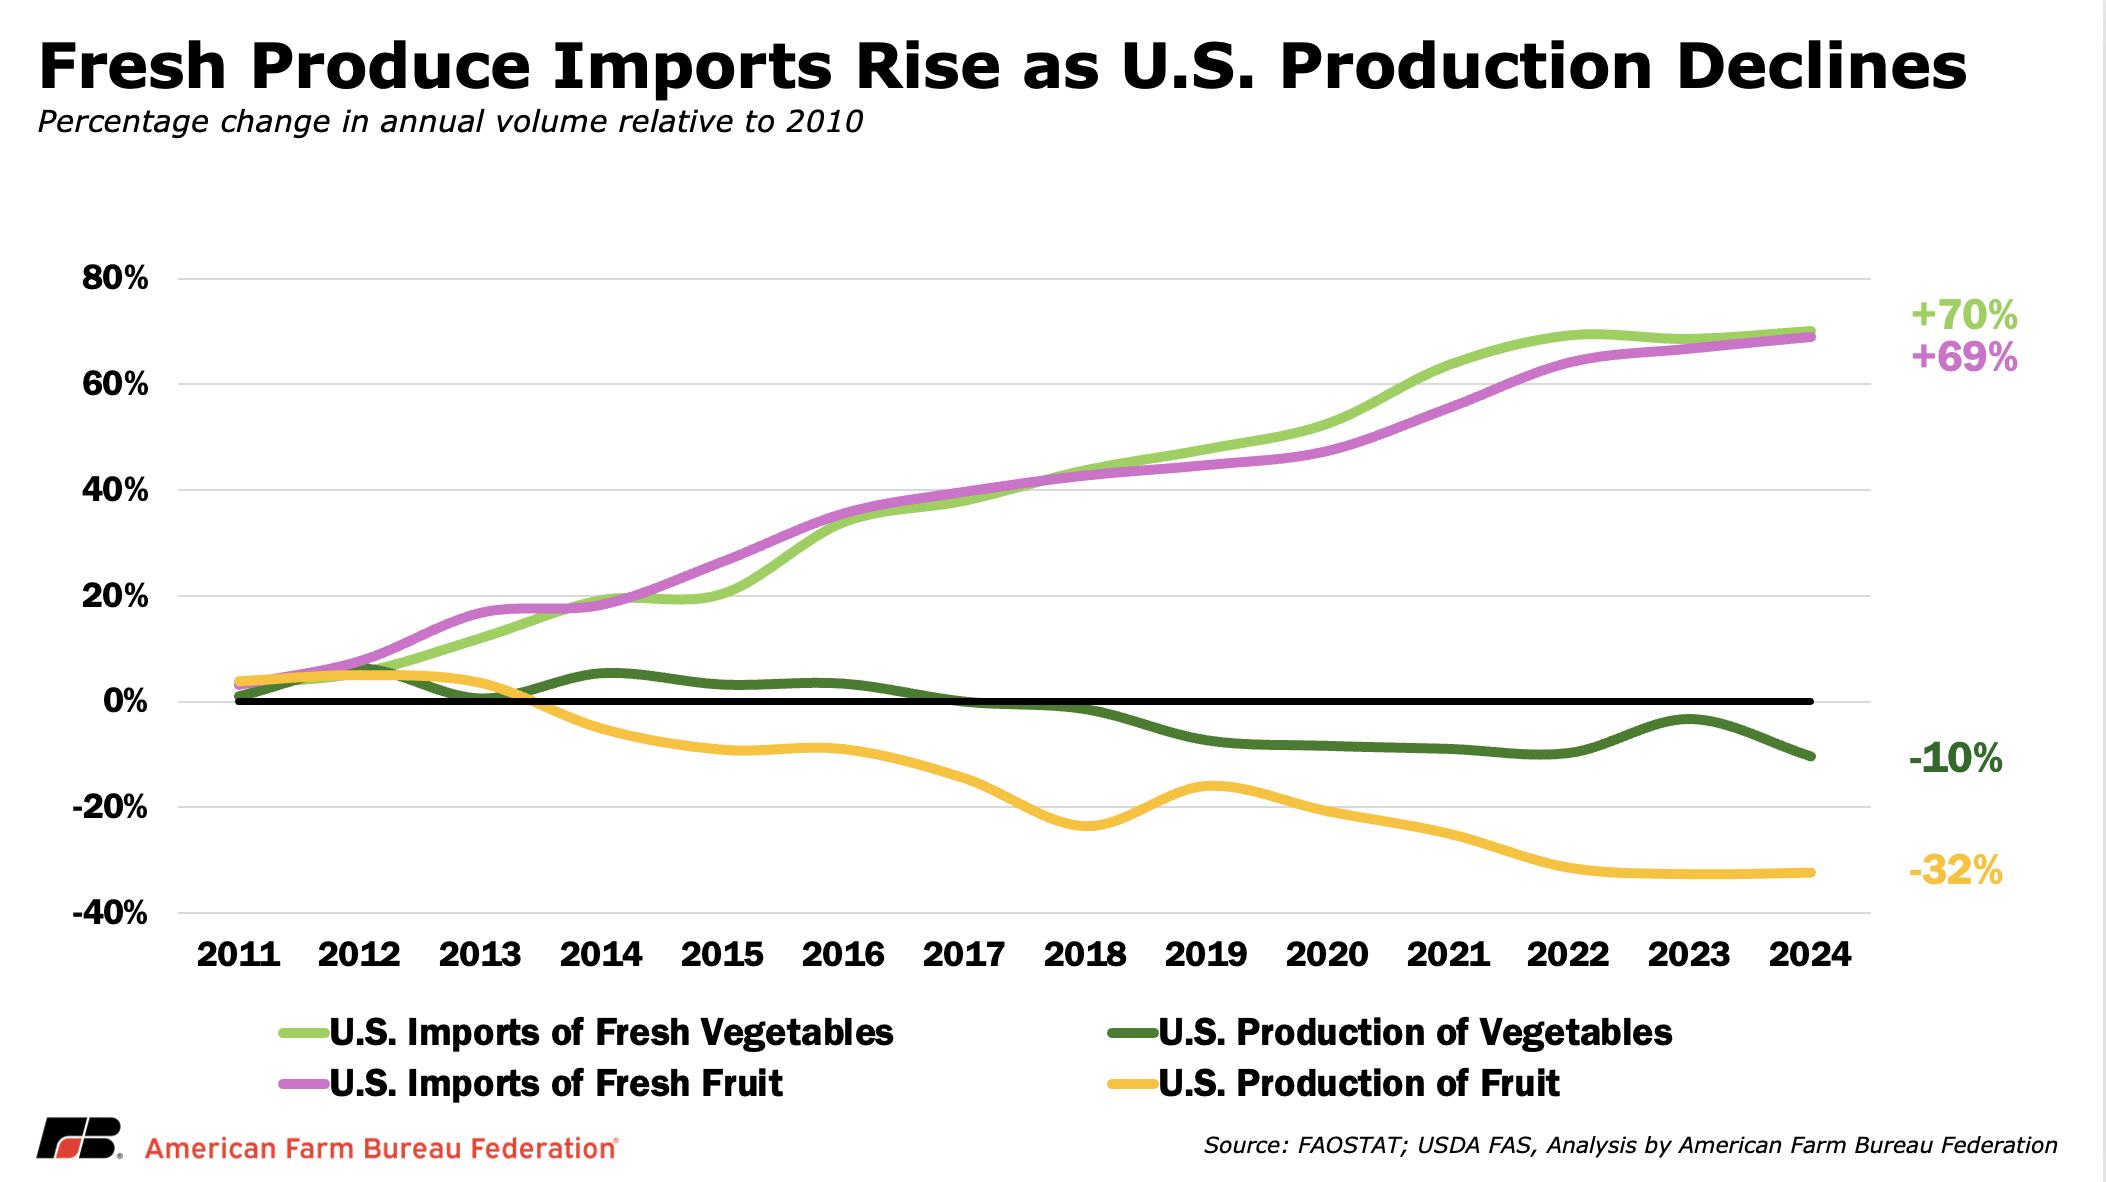
- Labor, input and regulatory expenses have climbed sharply, making it harder for domestic produce growers to recover costs, invest in their operations, and keep up with consumer demand. Since 2010, U.S. fruit production has declined 32% and vegetable production has fallen 10%, while fresh fruit and vegetable imports have each increased about 70%.
- Foreign supply still fills important seasonal gaps and supports year-round consumer demand, but imports are arriving in greater volumes during active domestic seasons, adding lower-cost competition when growers must market highly perishable crops.
- Import pressure extends across a range of fresh produce markets. The pattern varies by commodity, from higher year-round import volumes for lettuce and cabbage to sharper overlap during important blueberry, strawberry and tomato harvest windows. Together, these examples show that growing competition is not confined to a single crop, region or season.
- Growing dependence on foreign production can create food security risks. As U.S. production declines, more of the nation’s fresh produce supply becomes exposed to political instability, extreme weather, food-safety disruptions and regulatory decisions governed by other countries. Trade will remain essential, but a resilient food system requires U.S. farmers to be able to profitably grow fruits and vegetables here at home.
Fresh produce markets run on strict timing. Fruits and vegetables are highly perishable, harvest windows are often short, and growers generally cannot store a crop while waiting for prices to improve. A few weeks of excess supply can determine whether a season ends in profit or loss.
Imports are an essential part of this system. They fill seasonal production gaps, support year-round consumer demand, and strengthen integrated supply chains. Yet the rapid growth of foreign supply, and its increasing overlap with active U.S. harvest periods, has created legitimate concerns about downward price pressure during the narrow windows when domestic growers must sell their crops.
Those pressures are particularly difficult for U.S. growers facing rising labor, regulatory, input and compliance costs that are often difficult to pass on to buyers. These competitive challenges do not diminish the broader value of agricultural trade. Rather, it highlights the need for a trade environment that preserves reliable consumer access while ensuring U.S. growers have a viable opportunity to compete.
Rising Costs, Falling Production and Greater Import Reliance
U.S. fruit and vegetable growers face an increasingly difficult cost environment. Many crops require extensive hand labor, specialized equipment and substantial spending on food safety, water quality, pest management and environmental compliance. A Cal Poly study of Salinas Valley lettuce operations found compliance costs rose from $109 per acre in 2006 to more than $1,600 per acre, increasing from about 1% to over 12% of total production costs. An Oregon State University study similarly estimated regulatory compliance costs of roughly $250 to $700 per acre across four cherry and pear operations, driven by H-2A requirements, worker safety and training, pesticide rules and worker housing. Those domestic cost pressures are compounded by significant differences in production costs abroad. An earlier University of Florida comparison, using 2013/14–2014/15 data, found labor costs averaged $2.81 for each eight-pound flat of Florida strawberries, compared with $1.27 for the same quantity exported from central Mexico, roughly 35 cents versus 16 cents per pound. Perishability, limited price transparency, and the lack of futures markets leave growers with few tools to absorb these added costs or manage sudden price declines.
Broader production expenses have also climbed sharply. Between 2020 and 2025, pesticide costs increased 25%, fuel rose 31%, fertilizer climbed 37%, and labor costs increased nearly 50%. Specialty crop farms averaged more than $466,000 in cash expenses in 2023, up 47% in two years, with labor accounting for nearly 40% of total costs.
As those pressures have constrained domestic production, imports have filled a growing share of U.S. supply. USDA estimates imports supplied 59% of U.S. fresh fruit availability and 35% of fresh vegetable availability in 2023, up from 50% and 20%, respectively, in 2007. Put differently, domestic sources accounted for about 41% of fresh fruit and 65% of fresh vegetables available to U.S. consumers. Between 2010 and 2024, fresh fruit and vegetable imports each increased by roughly 70%, while U.S. fruit production declined 32% and vegetable production fell 10%. Imports are not the sole cause of those declines, but they are increasingly filling the gap as the domestic sector struggles to meet demand. The U.S. population grew about 10% over that same period, meaning population growth explains some of the increase in overall demand, but is far smaller than the increase in import volumes. High labor, regulatory compliance and input costs make it harder for U.S. growers to expand production, recover costs and remain competitive, reinforcing the shift toward greater reliance on foreign supply.
Seasonality: Filling Gaps and Extending Windows
Import growth can mean different things depending on when a product arrives. Rising consumer demand for year-round fresh produce has encouraged investment in growing regions with seasons that complement U.S. production. Berry imports rise during winter when domestic supplies are more limited, orange imports peak as U.S. production declines in summer and fall, and pineapple imports remain relatively steady because domestic production is minimal.
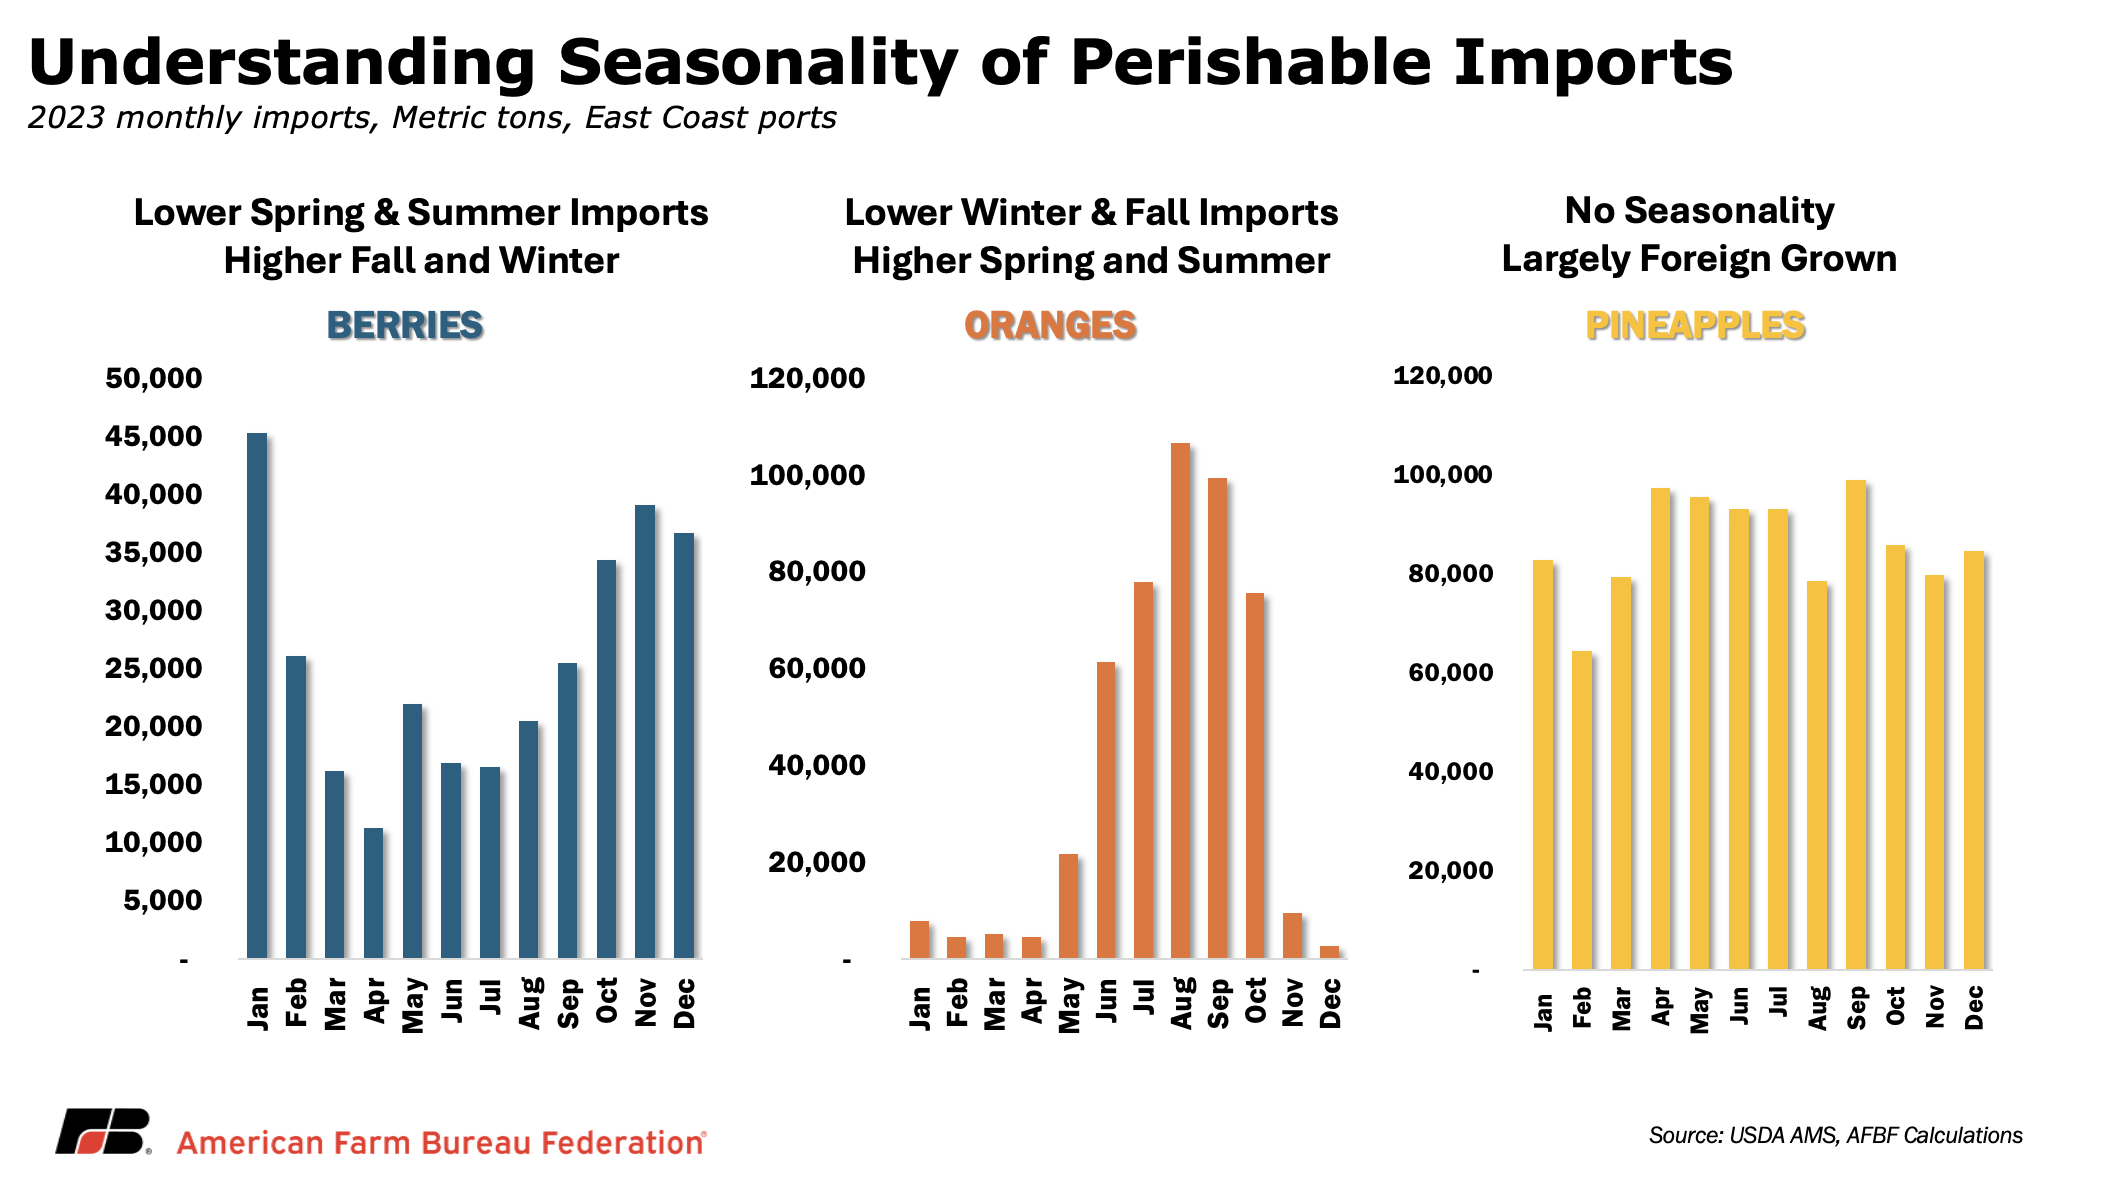
These trade flows give consumers access to products that were once available only seasonally and help retailers maintain consistent supplies throughout the year. Pressure on U.S. growers increases, however, when imports arrive earlier, remain later or grow during active domestic harvests. For highly perishable crops, even a short period of added supply can affect prices during the narrow window when growers must sell.
This expanding overlap, sometimes called market window creep, varies considerably by crop. The following examples range from imports that primarily fill domestic supply gaps to those that have become a larger presence during important U.S. harvest periods.
Watermelon: A Longer Import Season
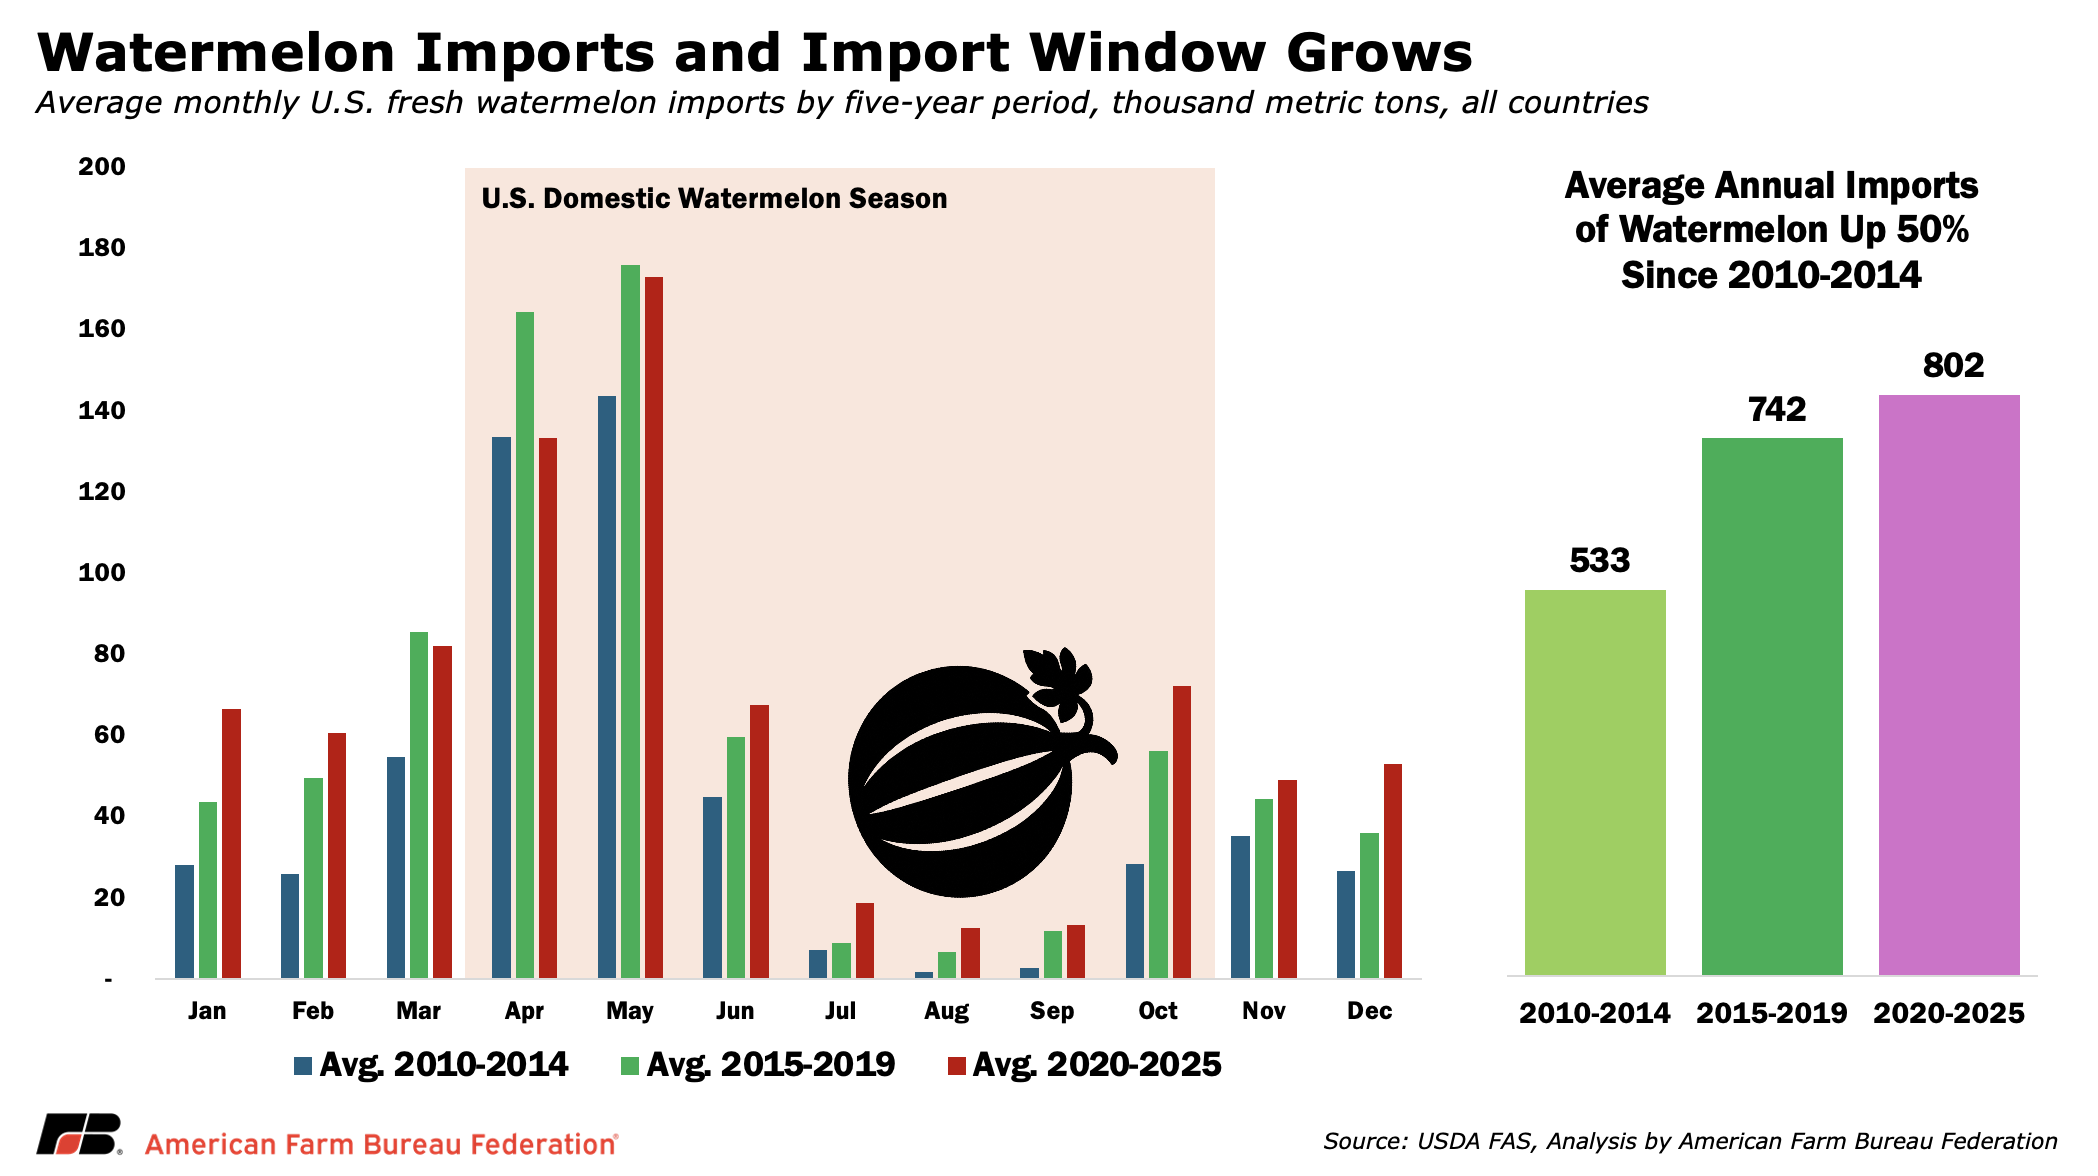
Watermelon offers a useful starting point because imports remain largely complementary to domestic production, but the edges of the import window have expanded. U.S. production runs from spring through early fall and typically peaks around July, led by Florida, Georgia, California and Texas. In 2024, domestic growers produced 1.68 million metric tons, while imports accounted for about 35% of U.S. supply and helped maintain availability before and after the main domestic season.
That said, average annual imports increased over 50%, from 533,000 metric tons in 2010–2014 to 802,000 metric tons in 2020–2025. Growth during the traditional April–May import peak was comparatively modest at 11%. However, June–July imports increased 67%, while October–December volumes nearly doubled.
The pattern suggests imports continue to serve their traditional role of filling seasonal gaps and meeting year-round demand, while also extending further into the shoulders of the U.S. season. For domestic growers, that means fewer months with limited import competition, including rising volumes as summer production is still moving through the market.
Lettuce: Import Growth Across a Year-Round Market
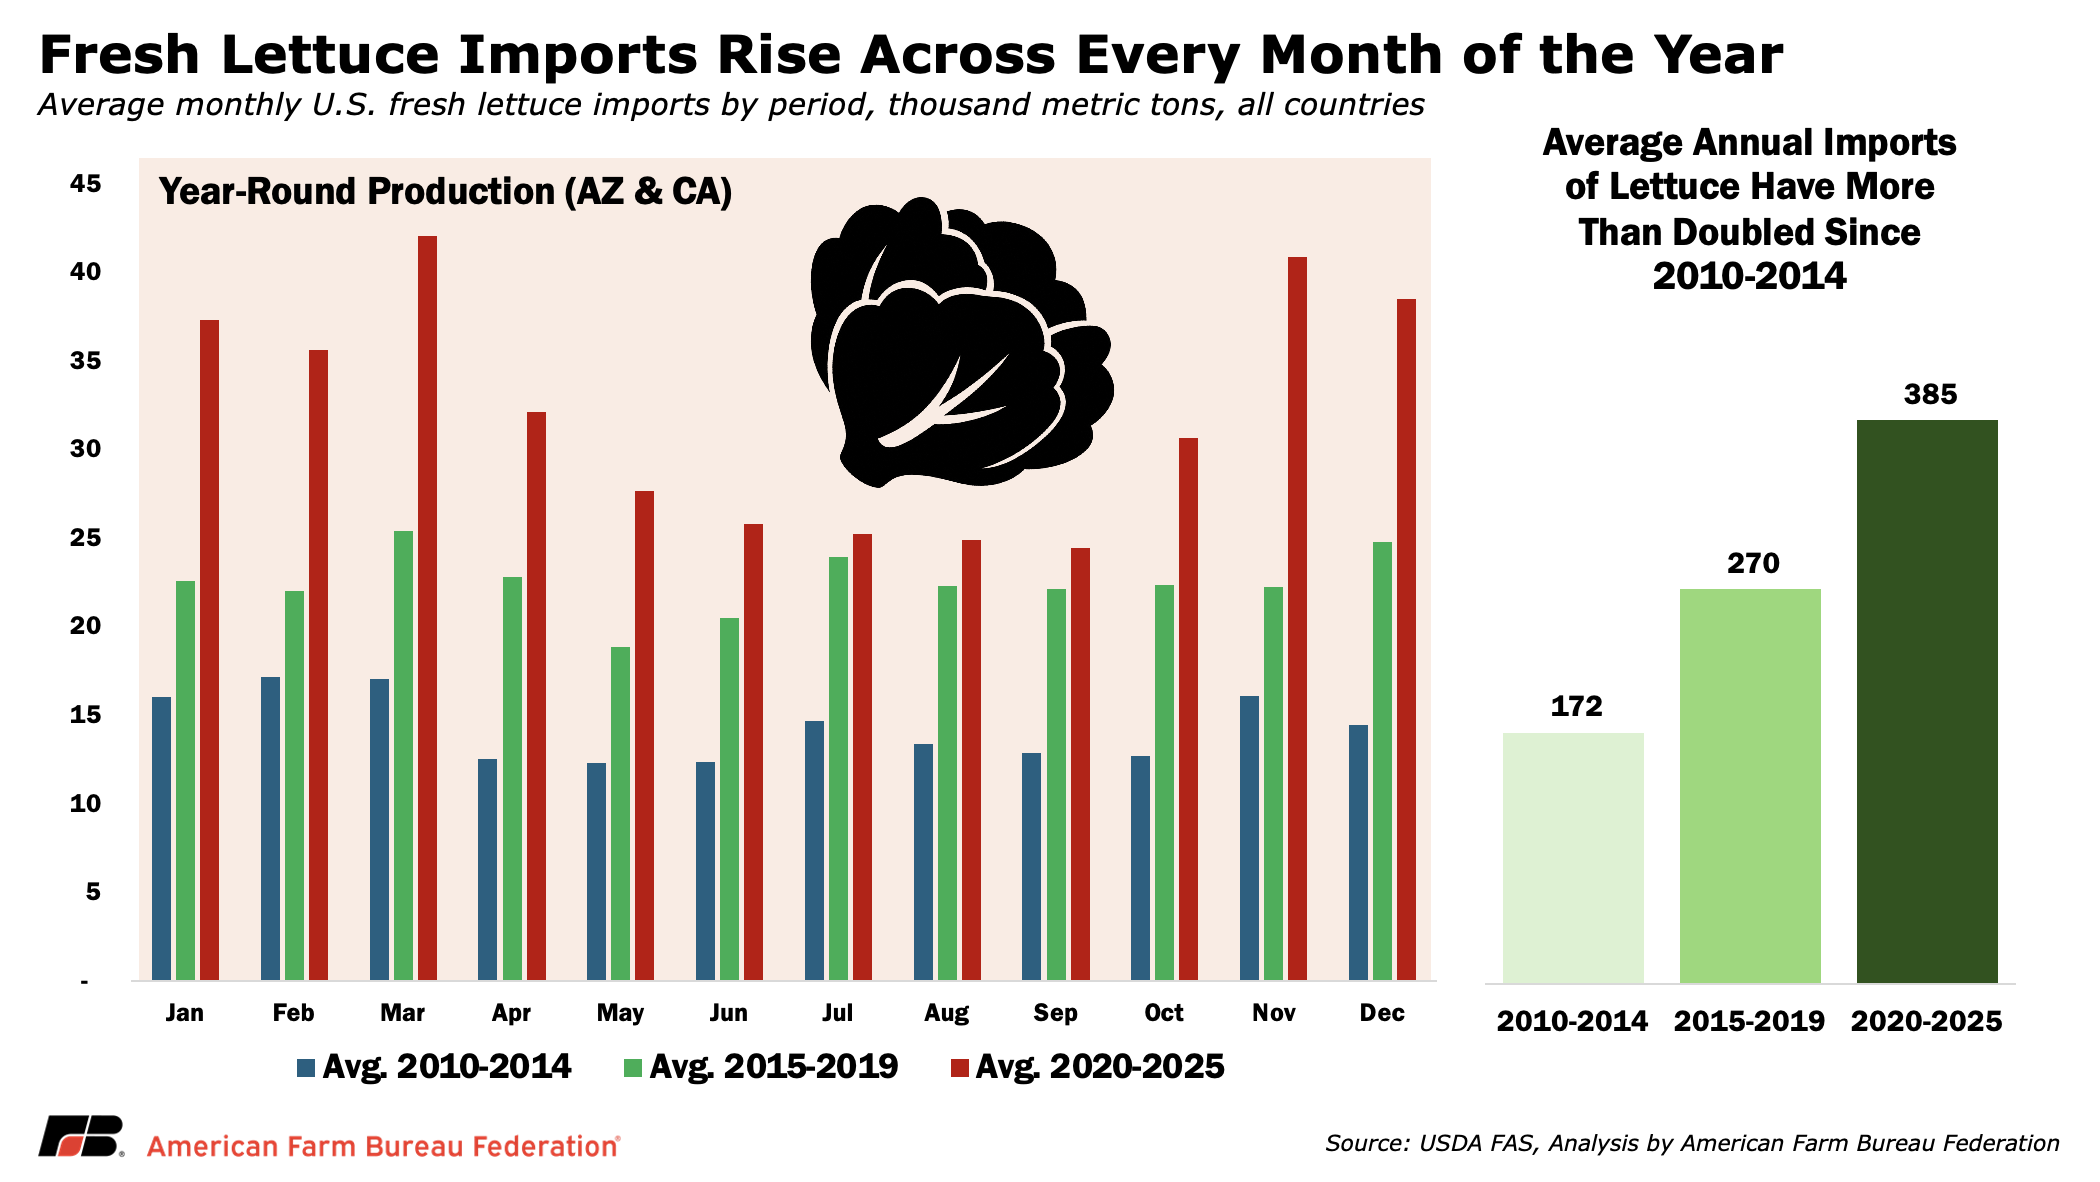
Unlike crops with a clear domestic off-season, U.S. lettuce production continues throughout the year by shifting between California’s coastal regions and the desert growing areas of California and Arizona. Those two states account for nearly all domestic output, allowing retailers to source U.S.-grown lettuce in every season. Domestic production accounts for most of the market, with USDA estimating U.S. growers supplied 85% of lettuce available to U.S. consumers in 2022.
Even so, average annual lettuce imports more than doubled, rising from about 172,000 metric tons in 2010–2014 to 385,000 metric tons in 2020–2025. Imports increased every month, with the largest gains concentrated during late fall, winter and early spring while U.S. domestic production remained flat.
Some of that growth helps buyers manage weather disruptions and transitions between U.S. growing regions. But with no true domestic off-season, rising imports also mean more consistent foreign competition across the production calendar. For growers already facing high labor, water and food-safety compliance costs, that added supply can make it harder to recover expenses during periods of otherwise adequate domestic production.
Cabbage: Higher Imports Throughout the Year
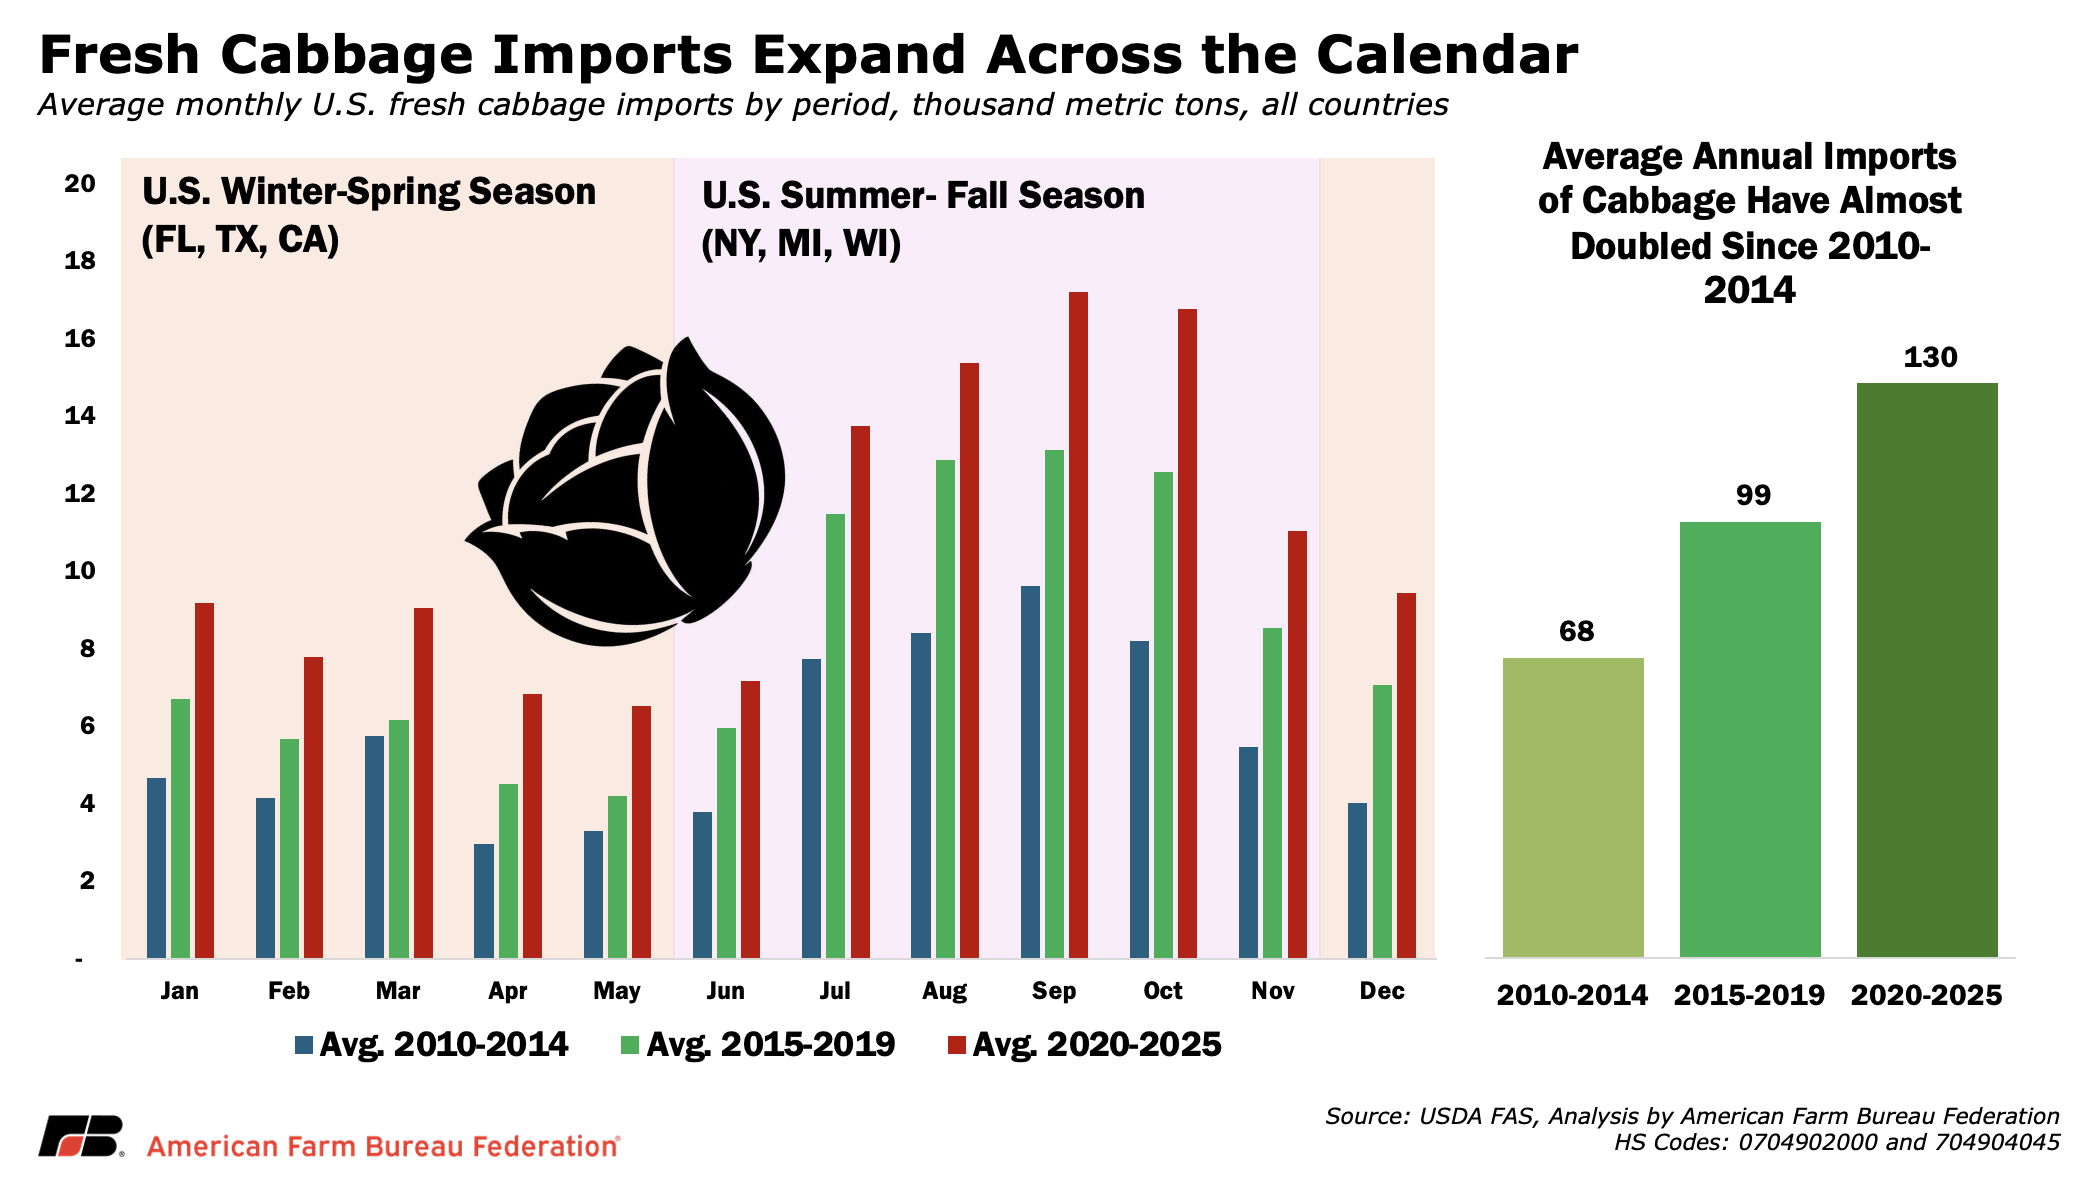
Cabbage is produced across several U.S. regions, with winter and spring supplies coming largely from Florida, Texas and California and later-season production shifting to northern states such as New York, Michigan and Wisconsin. That regional rotation gives the domestic market supply across much of the year. Yet domestic production has shown little growth, with U.S. cabbage output 11% lower in 2024 than in 2010. At the same time, USDA-based estimates show imports grew from about 4% of U.S. cabbage availability in 2000–2002 to 12% in 2017–2019.
That growing import presence has continued. Average annual imports have nearly doubled, increasing from about 68,000 metric tons in 2010–2014 to 130,000 metric tons in 2020–2025. Imports rose every month, with the largest volumes still concentrated from July through October.
Unlike crops where imports have clearly pushed into a new season, cabbage’s basic seasonal pattern has remained similar. The more notable change is that the entire import baseline has moved higher. Imports now provide more supply during both southern winter production and northern summer and fall harvests, creating more persistent competition across the domestic production calendar rather than a single period of concentrated overlap.
Blueberries: Imports Expand at Both Ends of the U.S. Season
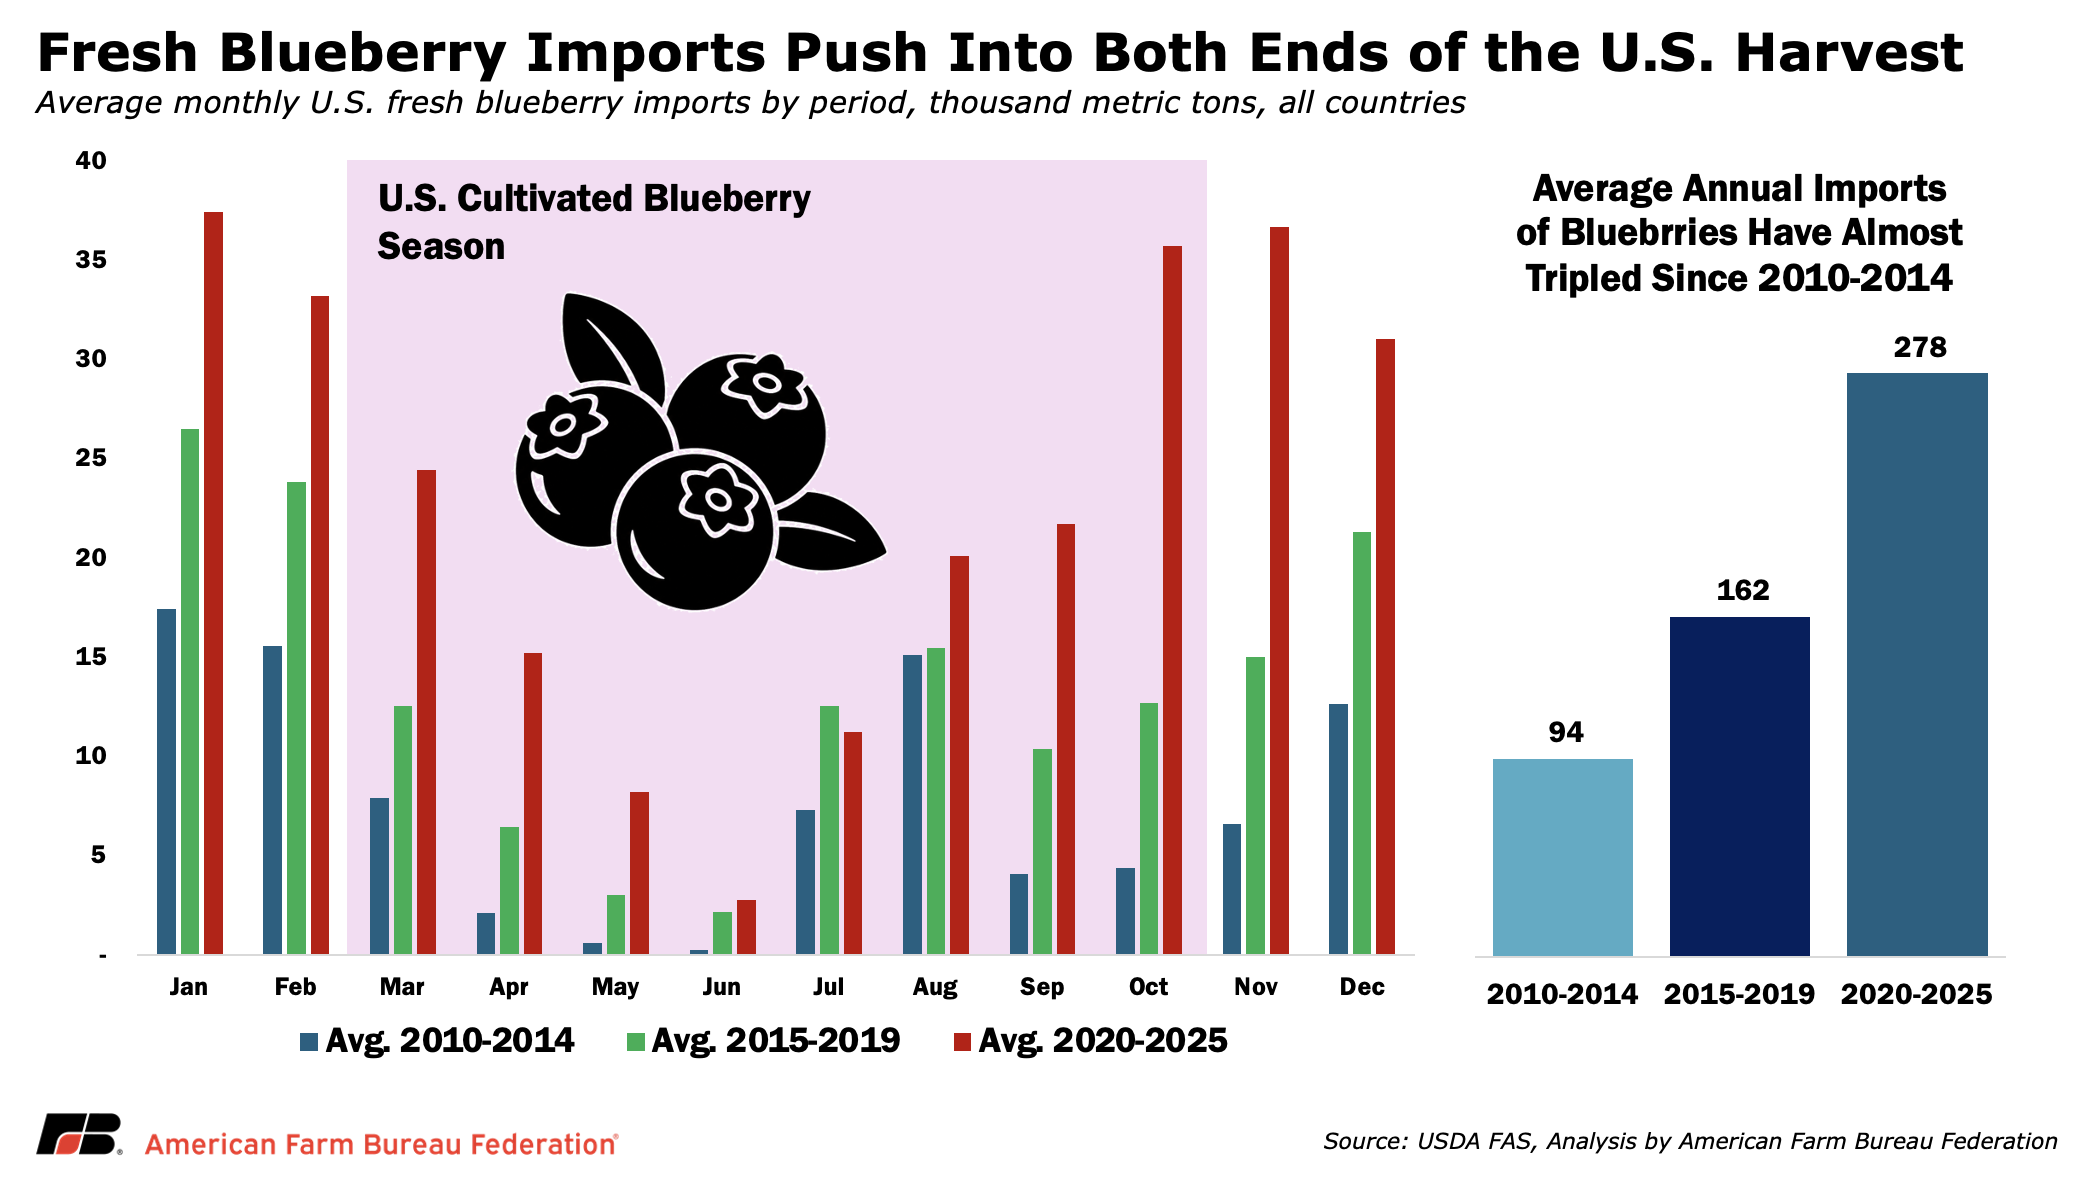
Blueberries illustrate how trade can expand consumer access while exposing U.S. growers to lower-cost competition that can undercut domestic prices and margins during critical marketing windows. Growing supplies from Peru, Mexico and Chile have extended the retail season as consumer demand has increased.
Average annual imports have nearly tripled, rising from 94,000 metric tons in 2010–2014 to 278,000 metric tons in 2020–2025. The sharpest gains occurred at the edges of the U.S. season. Average March imports more than tripled, April imports increased more than sevenfold, and October imports rose more than eightfold. Altogether, March–May imports increased 348%, while September–October volumes increased 576%.
Imports remain comparatively low during the core summer harvest. The greater change is that foreign supply now reaches much further into the early- and late-season windows when domestic growers often rely on stronger fresh-market prices to recover their costs. Despite rising domestic U.S. production of blueberries, imports have captured a growing share of the expanding market, increasing from 44% of domestic availability in 2005 to nearly 60% by 2018.
Strawberries: Winter Imports Intensify Competition During Florida’s Season
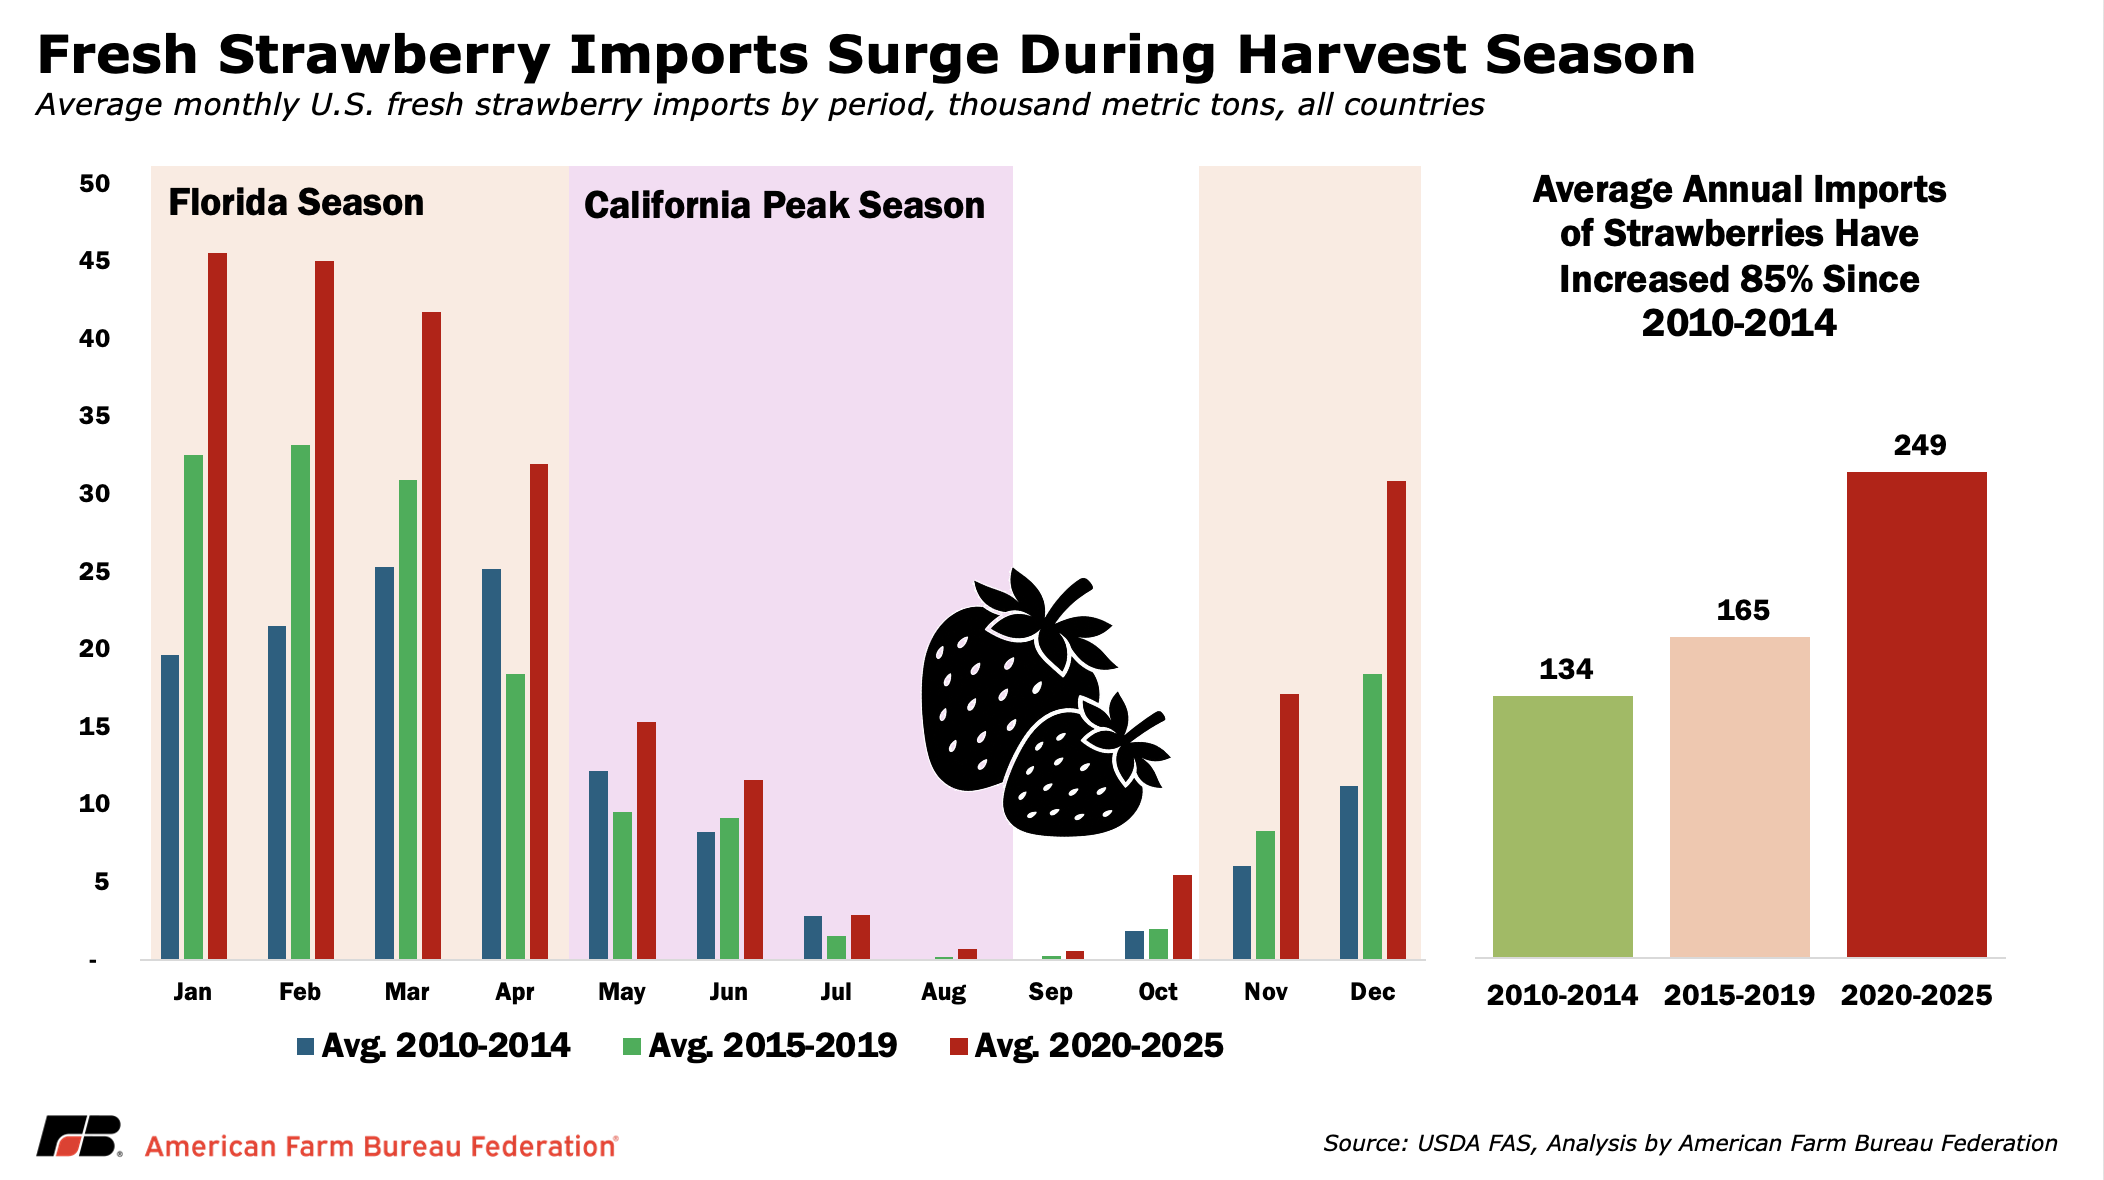
Strawberries are produced primarily in California and Florida, but consumers expect them year-round. Imports, mostly from Mexico, help maintain winter availability when California volumes are lower. That same timing, however, overlaps directly with Florida’s November–March season and the beginning of California’s spring harvest, exposing domestic growers to lower-cost competition when they are trying to recover some of agriculture’s highest labor, packaging and compliance costs.
U.S. strawberry production has remained relatively flat in recent years, while imports have continued to expand. Average annual imports have increased 85%, from about 134,000 metric tons in 2010–2014 to 249,000 metric tons in 2020–2025. The growth was concentrated in winter: November–March imports more than doubled, rising from roughly 84,000 to 180,000 metric tons. November volume nearly tripled, December imports rose about 175%, and January and February each more than doubled.
Imports still fall sharply during the summer, so the pattern is not year-round displacement. The pressure is concentrated in a commercially important window, with imports at their highest precisely when Florida growers are harvesting and California production is building. Over time, that growth has also increased the imported share of the U.S. strawberry market: USDA-based estimates put imports at about 18% of domestic availability in 2017–2019, up from roughly 6% in 2000–2002. This increases the risk that strong consumer demand does not translate into prices sufficient to cover domestic costs.
Tomatoes: Imports Expand into the U.S. Summer Harvest
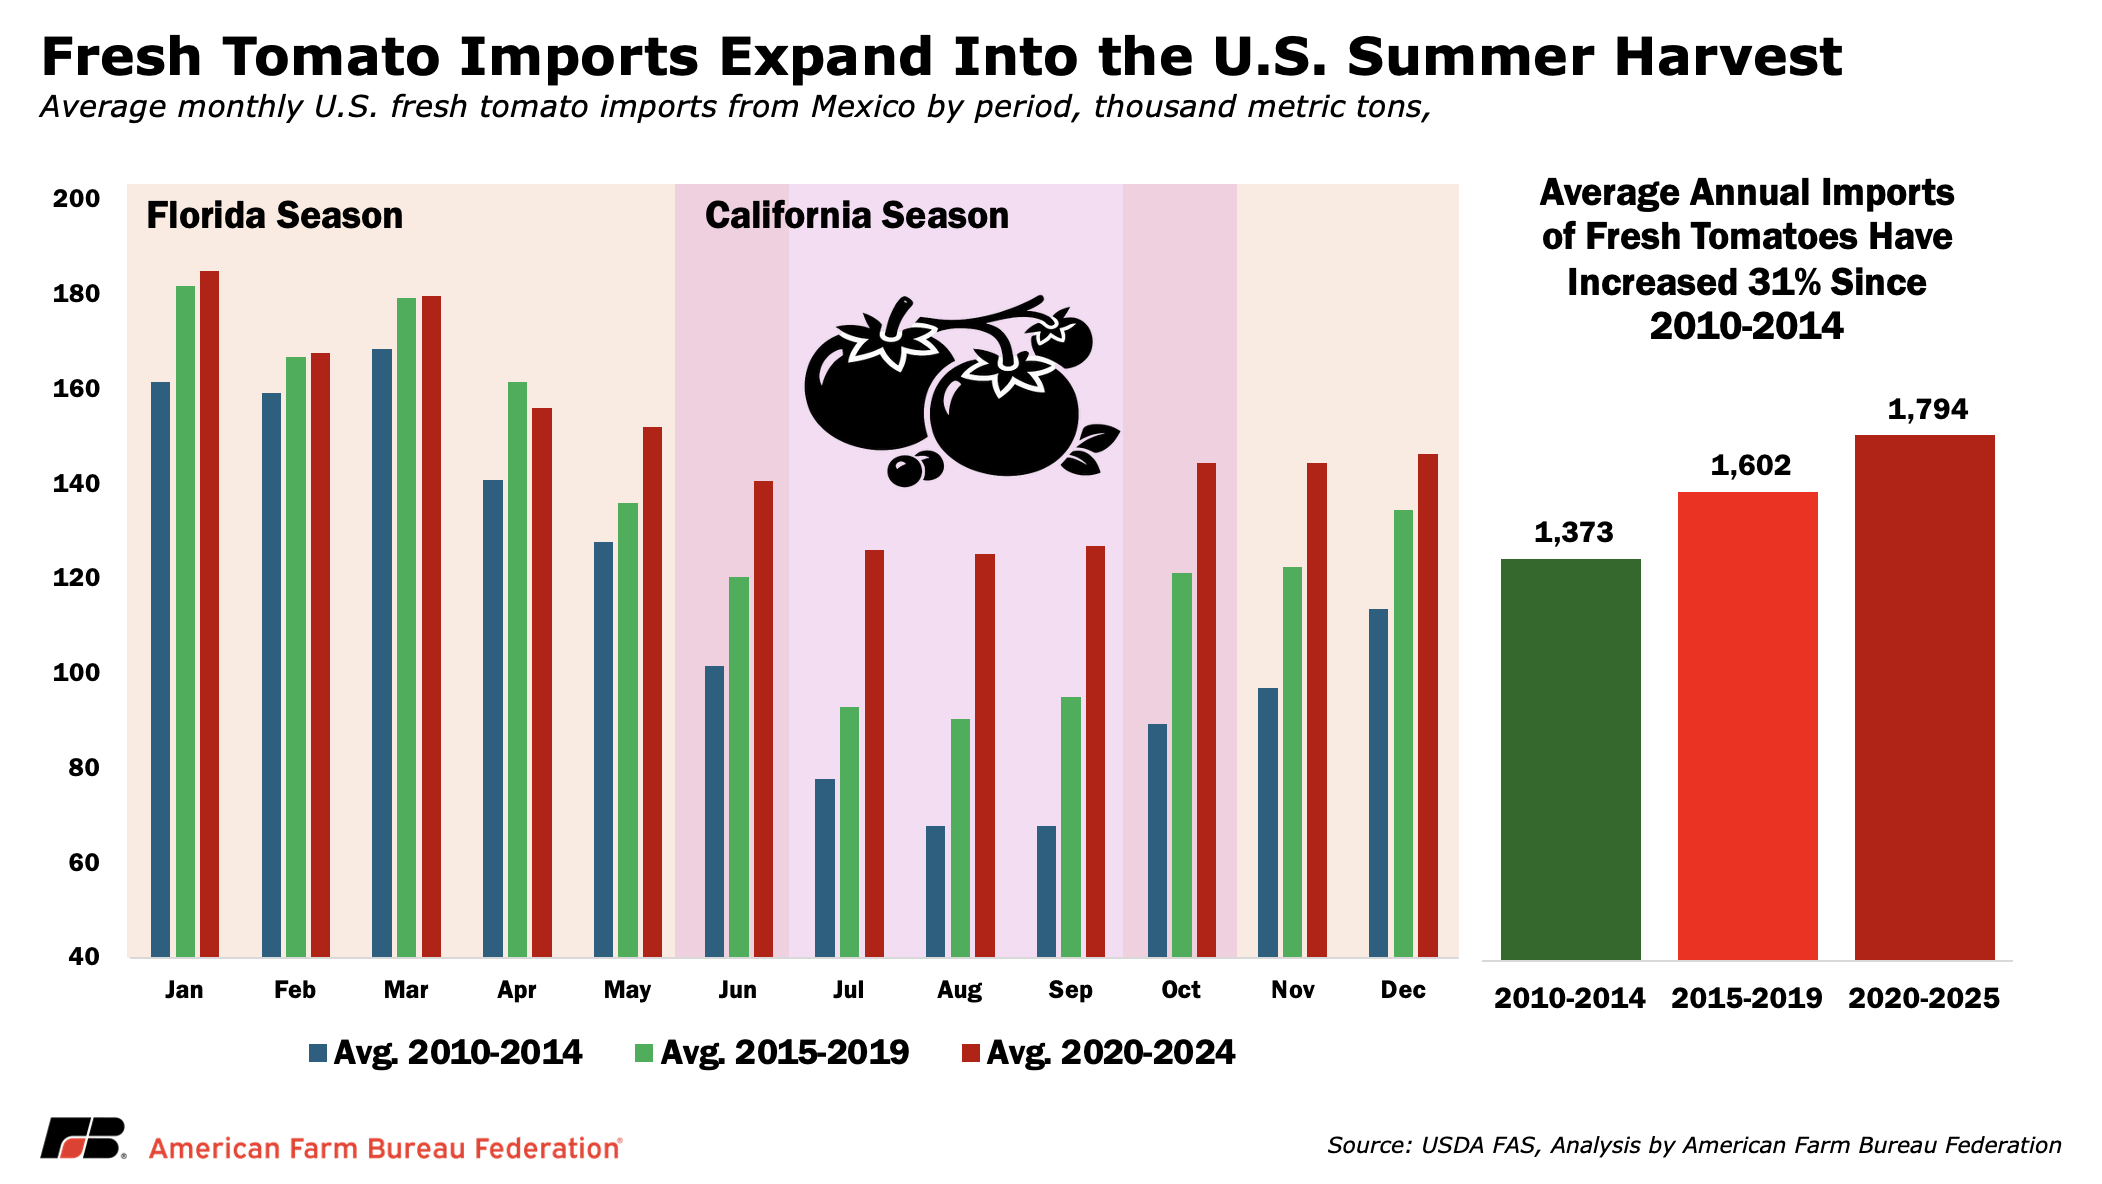
Fresh tomatoes are a year-round market, with Florida supplying much of the fall-through-spring crop, and California leading domestic shipments during summer. Mexico provides the overwhelming majority of U.S. fresh tomato imports, helping retailers maintain consistent supply across seasons. But as imports have grown, they have also expanded into what was once a pronounced summer trough in foreign supply. At the same time, U.S. fresh tomato production fell 24% between 2010 and 2024, and USDA estimates U.S. growers’ share of total fresh-tomato supply had fallen to 42% by 2017.
Average annual imports increased 31%, from about 1.37 million metric tons in 2010–2014 to 1.79 million metric tons in 2020–2024. Growth was much sharper during the domestic summer window: June–October imports rose 64%, while July–September volumes increased 77%. August and September imports each climbed about 85%, directly increasing competition during California’s primary season.
In July 2025, the Commerce Department ended the Tomato Suspension Agreement and imposed a 17.09% antidumping duty on most Mexican fresh tomatoes. Imports declined afterward: January–May 2026 shipments totaled about 748,000 metric tons, down 13% from the same period in 2025 and 13% below the 2022–2025 average. Every month was lower than a year earlier, including declines of 15% in January, 21% in February and 18% in May. While other market and production factors may also be involved, the change is consistent with a targeted trade remedy affecting shipment patterns. It also shows that specific pricing concerns can be addressed without treating the broader agricultural trade relationship as the problem.
Conclusion
The six crops analyzed represent a portion of the fresh produce market, but each shows how rising imports can increase pressure on U.S. growers. In some cases, that pressure comes from a steadily higher import baseline across the year. In others, foreign shipments have expanded directly into critical domestic harvest windows, when growers must quickly market highly perishable crops and recover their annual costs. Across most of the examples, U.S. production has been flat or declining even as imports have gained a larger share of the market.
That competition is especially difficult because many foreign suppliers operate with substantially lower labor, production and regulatory costs. U.S. growers face rising expenses for wages, worker housing, food safety, water quality, pesticide compliance and other requirements that are difficult to pass on to buyers. As those costs limit domestic acreage and investment, imports increasingly fill the resulting supply gap, reinforcing greater reliance on foreign production.
Trade remains essential to meeting consumer demand for affordable, year-round produce, and strong agricultural trading relationships benefit the broader food supply chain. But those benefits should not require accepting continued erosion of U.S. production capacity. Preserving a resilient produce sector will require reducing unnecessary domestic cost pressures, helping growers remain competitive and using targeted trade remedies when specific practices are proven to cause measurable harm. A dependable fresh produce supply ultimately requires both reliable trade partners and farmers who can afford to keep growing here at home.

