Persistent Losses Leave Farmers Needing Economic Support

Faith Parum, Ph.D.
Deputy Chief Economist
Daniel Munch
Former AFBF Economist
Key Takeaways
- Global instability is pushing production costs higher. Fertilizer and fuel costs were already elevated heading into 2026, and the conflict with Iran has added further pressure to those markets.
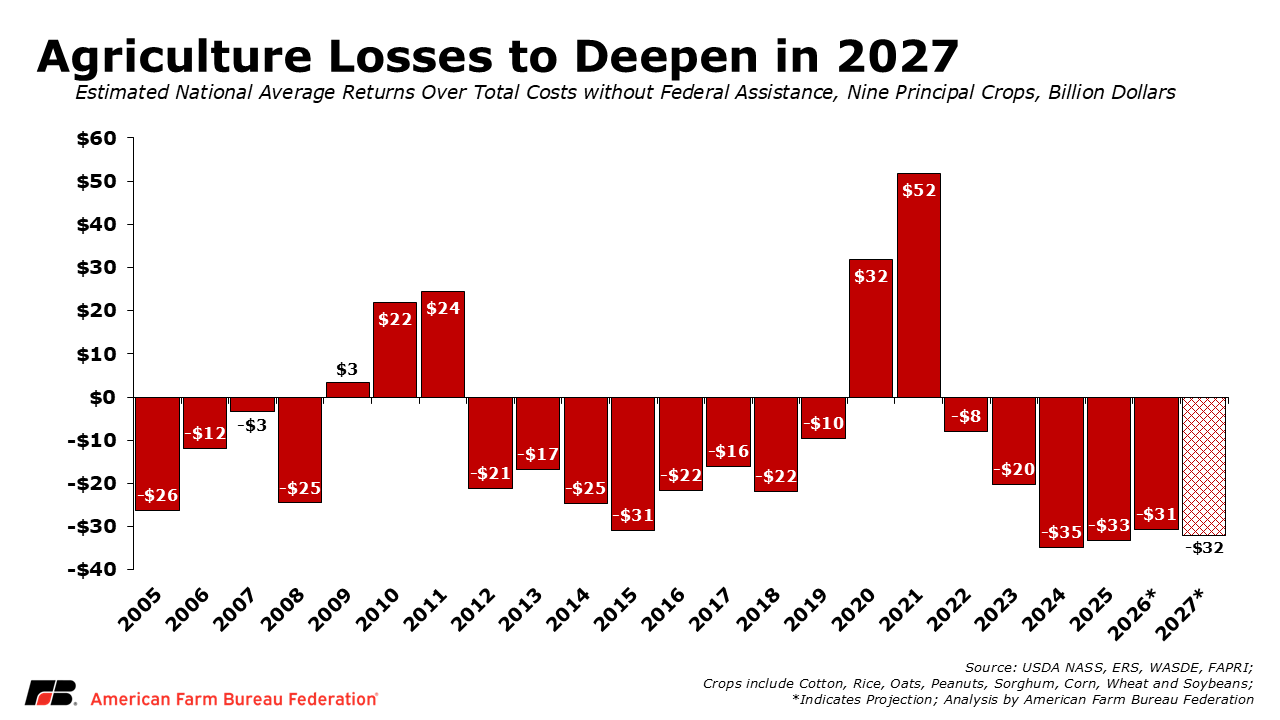
- AFBF analysis shows losses are expected to deepen in 2027. AFBF estimates that without federal assistance, farmers growing nine principal crops will lose $32 billion (national average returns over total costs) in 2027, compared to $31 billion in 2026. On a per-acre basis, every crop analyzed is projected to remain below breakeven in 2027.
- Fruit, vegetable, nut and other specialty crop losses remain largely uncovered. AFBF estimates farmers growing six representative crops faced more than $7 billion in 2025 losses. The ASCF program provides welcome relief, but payment rates cover only about 5% to 28% of estimated 2025 per-acre losses for the crops analyzed. Available 2026 data show difficult market conditions continue, including below-breakeven prices, acreage reductions and weak margins across major specialty crop sectors.
- Additional economic assistance is needed and is supported on a bipartisan basis. Additional financial support is critical to offset trade-related losses, rising input costs and the deep financial pressure facing U.S. row crop, specialty crop, hay and sugar producers. This support would help stabilize the farm economy, sustain rural communities and maintain a strong domestic food supply.
- Longer term, policy solutions to help stabilize the farm economy are needed. Such as year-round E15; a modernized five-year farm bill that protects interstate commerce from a patchwork of state legislation; a legislative fix to agricultural labor; and stronger risk management tools, including better data collection and publication to support more effective options for specialty crop producers.
Crop farmers continue to face elevated production costs, lower commodity prices and tight margins – with no relief on the horizon. AFBF analysis projects 2027 will mark a sixth year of negative returns over total costs for most major row crops. Specialty crop farmers are experiencing similar financial strain, facing expected below-breakeven prices and acreage reductions across major fruit, vegetable and tree nut sectors in 2026, even as limited public data make the full scale of losses difficult to measure. At the same time, fertilizer and fuel prices remain volatile, with the Iran conflict adding additional pressure to those markets.
Row Crops
USDA’s June 30 Acreage report provides an updated acreage baseline for estimating the scale of economic losses across major row crops. Total U.S. principal crop acres are estimated to be down 1.91 million acres from 2025, a 0.6% decline overall. Corn planted area is estimated at 95.3 million acres, down 3% from last year but still the fourth-highest planted corn acreage in the U.S. since 1944. Soybean planted acreage is estimated at 85.4 million acres, up 5% from 2025, while all wheat planted area is estimated at 42.7 million acres, down 6% from last year.
Using USDA-Economic Research Service cost of production data, World Agricultural Supply and Demand Estimates data, USDA-National Agricultural Statistics Service acreage data and Food and Agricultural Policy Research Institute projections, AFBF estimates national average returns over total costs, without federal assistance, at a $32 billion loss across nine principal crops in 2027, deepening from a $31 billion loss in 2026. These 2026 and 2027 figures represent projected, not realized, losses. Producers still have time to adjust acreage and input decisions, while weather, yields, market prices and other factors could change the final outcome. The 2027 estimate assumes crop prices remain at 2026 levels, though actual prices will vary in response to changing market conditions
On a per-acre basis, losses are projected across every major crop analyzed. Corn losses are projected to increase from $131 per acre in 2026 to $167 per acre in 2027. Soybean losses are projected to increase from $80 per acre to $138 per acre, wheat losses from $114 per acre to $145 per acre and cotton losses from $342 per acre to $406 per acre. Rice, sorghum, oats, barley and peanuts are also projected to remain below breakeven.
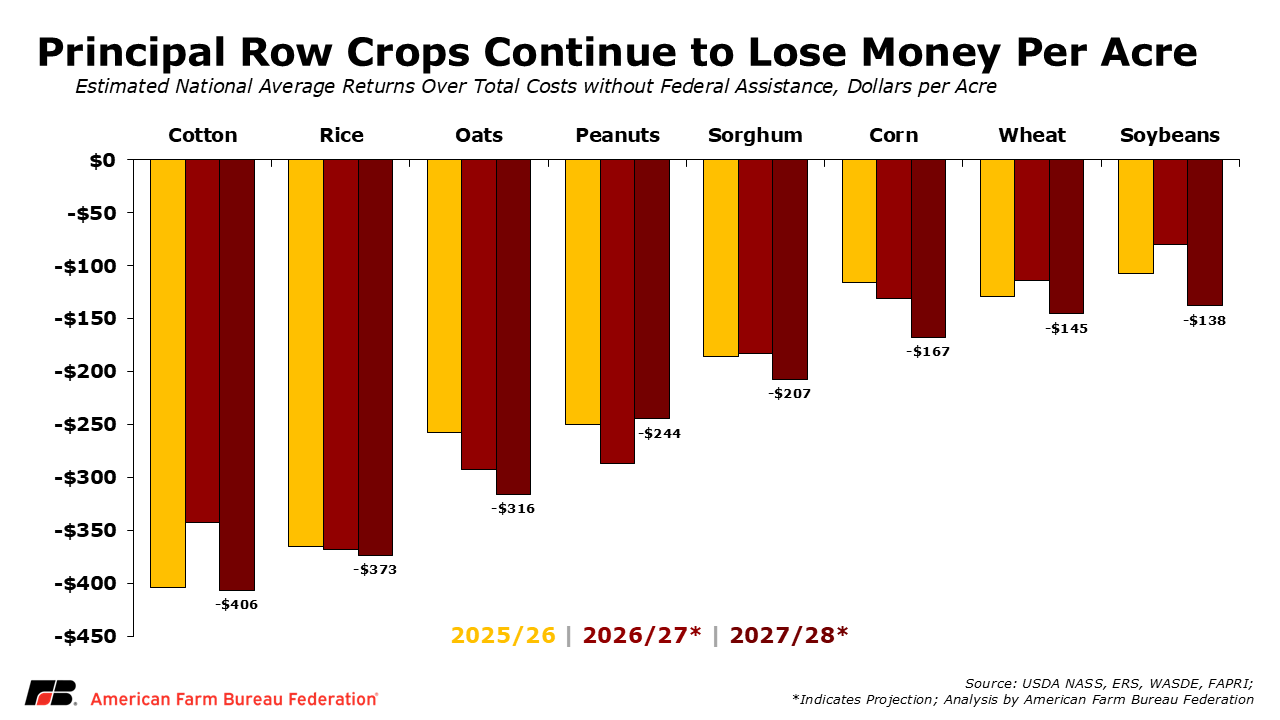
In total dollar terms, corn accounts for the largest projected loss at $15.8 billion, followed by soybeans at $11.6 billion, wheat at $6.6 billion and cotton at $3.8 billion. Combined, losses across the nine principal crops are projected to reach $41.4 billion in 2027.
Specialty Crops
Specialty crop producers face many of the same cost and market pressures, but the full scale of losses is more difficult to quantify because consistent, timely public data on production costs and prices received by farmers is lacking for many crops. This data gap should not be mistaken for a lack of hardship. AFBF’s earlier analysis of almonds, apples, blueberries, lettuce, potatoes and strawberries, six crops representing roughly one-quarter of specialty crop receipts, identified over $7 billion in estimated 2025 economic losses as labor, input, compliance and capital costs outpaced farm-level returns.
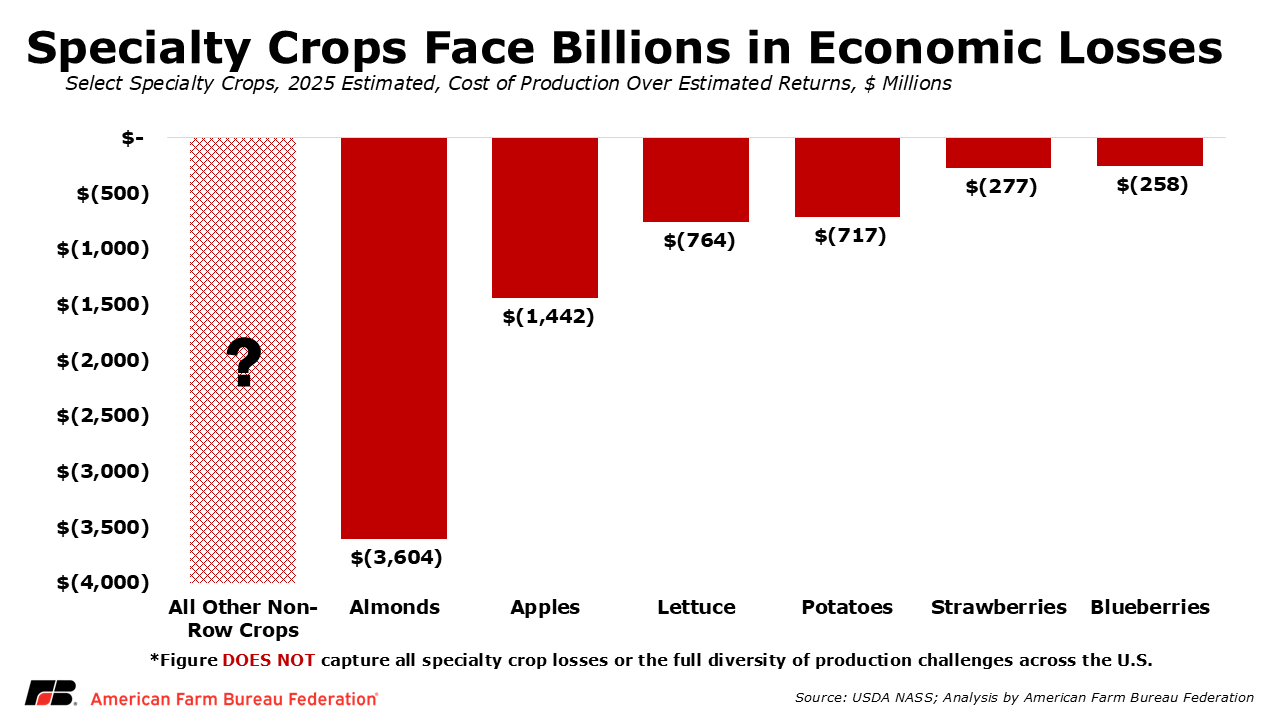
Available 2026 market data show that conditions for specialty crop producers have not broadly improved. For example, potato growers planted 873,000 acres in 2026, down 3% from 2025 and the lowest level since 1952. AFBF’s earlier analysis estimated a 2025 weighted open-market potato price of $6.88 per hundredweight, already well below average full production costs of $12.25. In early 2026, analysts reported some uncontracted potatoes selling for just $2 to $3 per hundredweight and continued to describe the market as unprofitable. Other specialty crop markets show a similar lack of recovery. In June, agricultural analysts continued to rate both apple and wine grape producers as unprofitable.
Although some specialty crop prices have strengthened, those gains have been limited. Almond prices strengthened in May as the projected 2026 crop fell below the five-year average, partly after growers removed acreage or reduced production activities in response to several years of weak margins. California strawberry prices also increased after weather reduced available volume. In both cases, stronger prices were tied at least partly to tighter supplies, while labor, fertilizer, energy, compliance and capital costs remained elevated. When higher prices result from weather-related production losses or acreage removals, growers also have less product to sell, limiting any improvement in farm-level revenue and leaving overall margins under pressure.
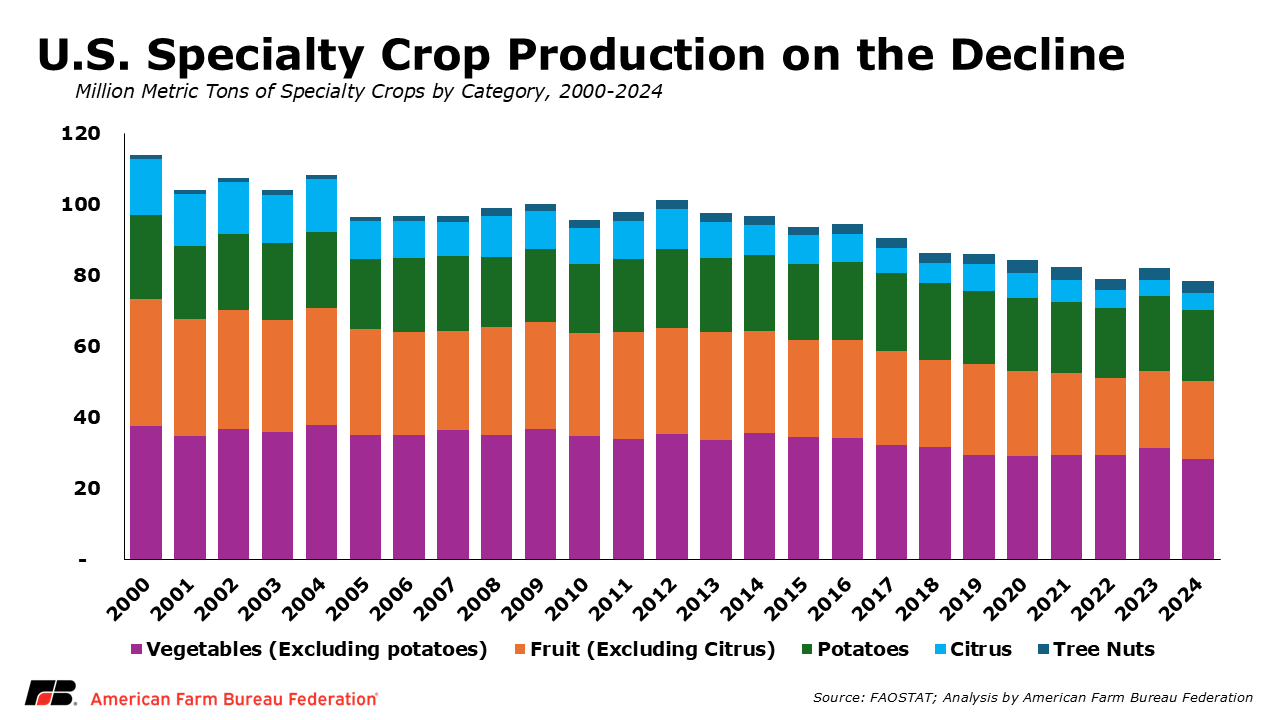
Recent economic conditions also point to a shrinking domestic specialty crop footprint. Since 2000, U.S. vegetable acreage has declined 41%, while production has fallen 24%, from 37 million metric tons to 28 million in 2024. Fruit acreage, including citrus, has declined 37%, while production has fallen 48%, from 51 million metric tons to 26 million. Tree nut production strengthened during years of stronger markets, peaking at 3.7 million metric tons in 2020, but had fallen to 3.2 million by 2024. These declines reflect the cumulative effects of weak market returns, rising labor costs, import competition, weather, disease, and water constraints. Although they do not provide a direct measure of producer losses, they show how sustained financial and production pressures are shrinking domestic specialty crop capacity.
Why More Economic Assistance is Needed
Congress and the administration have already taken important steps to respond to these economic headwinds. In late 2024, Congress passed the American Relief Act, which included $10 billion in aid for row crop farmers through the Emergency Commodity Assistance Program (ECAP) to address economic losses from the 2023 and 2024 crop years. The Farmer Bridge Assistance Program provided $11 billion in short-term economic relief to row crop farmers, while USDA initially reserved another $1 billion for specialty crop and sugar assistance for losses felt in 2025. USDA later finalized $1.625 billion specifically for eligible fruit, vegetable and tree nut growers through the Assistance for Specialty Crop Farmers (ASCF) Program, an increase from the amount originally set aside, with sugar assistance addressed separately. Together, these programs provided more than $23 billion in economic assistance.
Through H.R. 1, Congress also made several significant longer-term improvements to commodity programs and the farm safety net. Higher reference prices, expanded crop insurance options and other provisions will provide meaningful support as they are implemented, with the first Agriculture Risk Coverage (ARC) and Price Loss Coverage (PLC) payments expected in October 2026.
Since the enactment of H.R. 1, fertilizer, fuel and other production costs have continued to rise, while prices for many major commodities have remained flat or declined. As a result, row crop, specialty crop and alfalfa farmers are entering the fall under intense financial strain. Some sectors of agriculture are projected to face a seventh consecutive year of losses in 2027, leaving cumulative shortfalls that remain well beyond the support provided to date.
The scale and persistence of those losses have drawn bipartisan backing from President Trump and leaders of both parties on the House and Senate Agriculture committees. In late June, the president requested more than $11 billion in additional agricultural assistance from Congress. The proposal would provide $10 billion for row and specialty crop producers with crops planted in 2026, with another $1.1 billion directed to Florida producers affected by winter storms. The proposal also urges Congress to pass year-round E15. Congressional work to assemble this supplemental package and determine program details are still needed. The final package must be sufficiently robust and broadly structured to reflect the depth of losses across agriculture.
Economic Support Needed Now
Multiple years of high input costs, declining crop prices, trade uncertainty, global energy volatility and negative margins have weakened farm balance sheets and reduced working capital. Without additional support, more farmers will face difficult decisions about whether they can continue operating into the next crop year.
Near-term economic assistance is needed to help farm families offset trade-related losses and increased input costs intensified by geopolitical conflict.
Longer-term policy solutions are also needed to strengthen the farm economy beyond immediate assistance. Swift implementation of farm bill improvements; protecting interstate commerce from a patchwork of state laws; stronger risk management tools, including better data collection and publication to support more effective options for specialty crop producers; and domestic market-expanding policies like year-round E15 can help improve demand, provide certainty and reduce the risk of further farm closures.
Together, short-term assistance and long-term policy solutions will help protect rural communities and ensure farmers can continue producing the food, fuel and fiber Americans rely on.
AFBF analysis estimates national average returns over total costs using USDA ERS cost of production data, USDA WASDE estimates, USDA FSA prices, USDA NASS acreage data and FAPRI projections. Estimates are intended to provide a national view of crop sector financial conditions and will vary by farm, region, yield, marketing decisions and cost structure.