H-2A Growth Slows, But Remains Strong

photo credit: Colorado Farm Bureau, Used with Permission
Veronica Nigh
Former AFBF Senior Economist
The Department of Labor recently released full fiscal year usage data for the H-2A program. Given agriculture’s ongoing struggle to recruit domestic workers and a very tight U.S. labor market overall, it should be no surprise that H-2A program usage reached new highs again in fiscal year 2023 (October 2022-September 2023), though the rate of growth was down considerably from last year.
H-2A
As highlighted in the recent article, 2024 H-2A AEWRs On Their Way (Up), the U.S. labor market remains very tight, with an unemployment rate that averaged 3.6% in fiscal year 2023, so it shouldn’t be a shock that usage of the H-2A program remains high. In fiscal year 2023, DOL certified 378,513 H-2A positions, an increase of 2% over fiscal year 2022. This relatively small increase followed a very large increase in fiscal years 2021 and 2022, when the number of certified positions increased by 15% and 17%, respectively. Over 100,000 (103,083) more positions were certified in fiscal year 2023 than in fiscal year 2020, despite an increase of nearly 19% in the national average Adverse Effect Wage Rate (the minimum wage employers who participate in the H-2A program are required to pay).
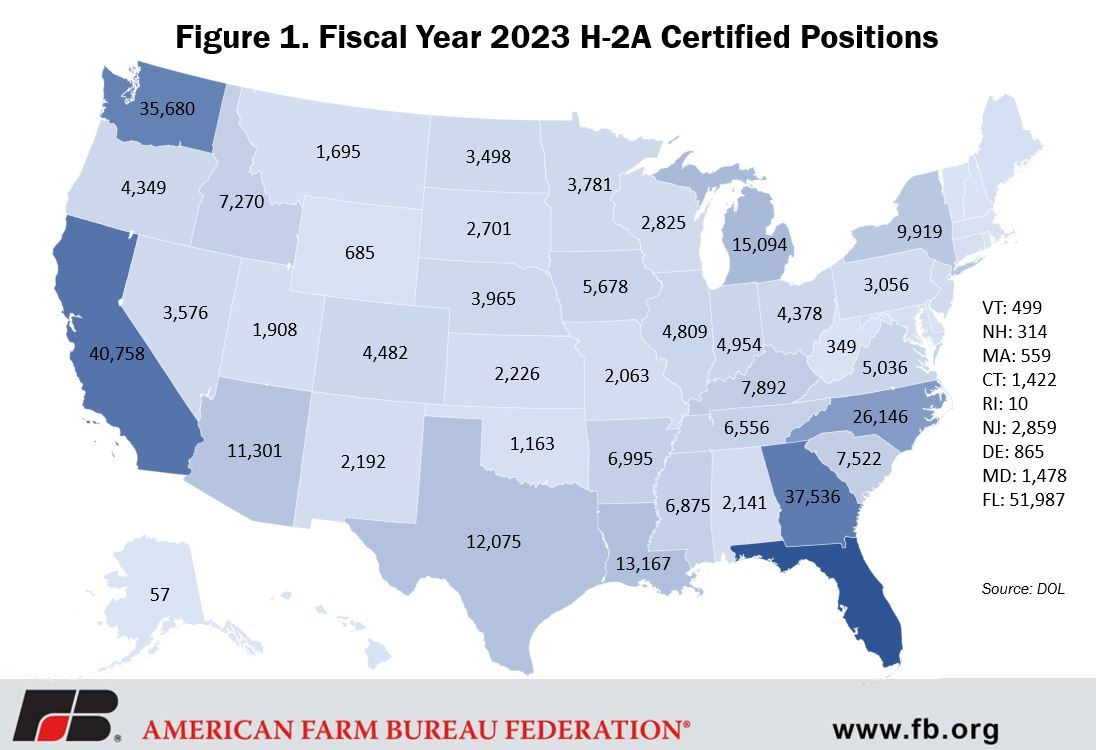
The top 10 states for H-2A program utilization in fiscal year 2023 mirrored fiscal year 2022’s top 10. From the largest number of certified positions to the smallest the top 10 states were: Florida (51,987), California (40,758), Georgia (37,536), Washington (35,680), North Carolina (26,146), Michigan (15,094), Louisiana (13,167), Texas (12,076), Arizona (11,301) and New York (9,919). These top 10 states, account for two-thirds of all certified positions.
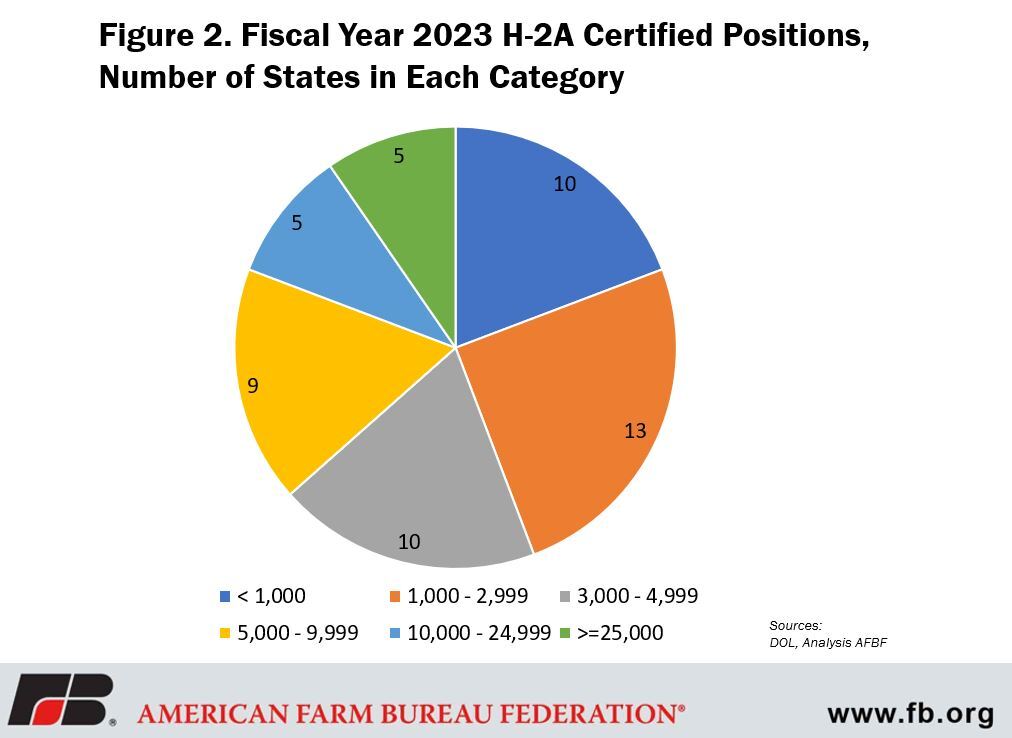
In the past, we complained that H-2A program use information was unavailable for states that were not among the top 10 users. Thankfully, DOL has begun publishing H-2A Disclosure Data, which includes every H-2A application, so we now have information on program use for every state. With the availability of more data, we now also know more about the distribution of certified positions for all states. In fiscal year 2023, 10 states had fewer than 1,000 certified positions, 13 states had between 1,000 and 2,999 positions, 10 states had between 3,000 and 4,999 positions, nine states had between 5,000 and 9,999 positions, five states had between 10,000 and 24,999 positions and five states had 25,000 or more positions. It is worth noting that every single state and territory where AFBF has membership (all 50 states and Puerto Rico) had H-2A certified positions granted.
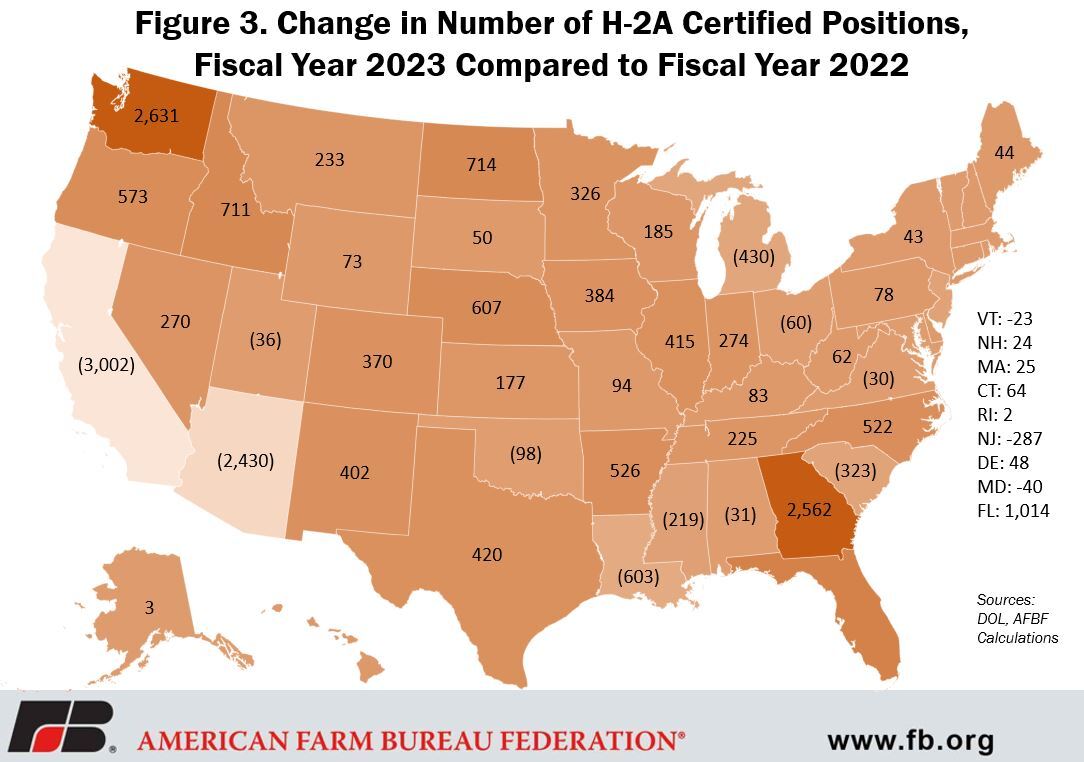
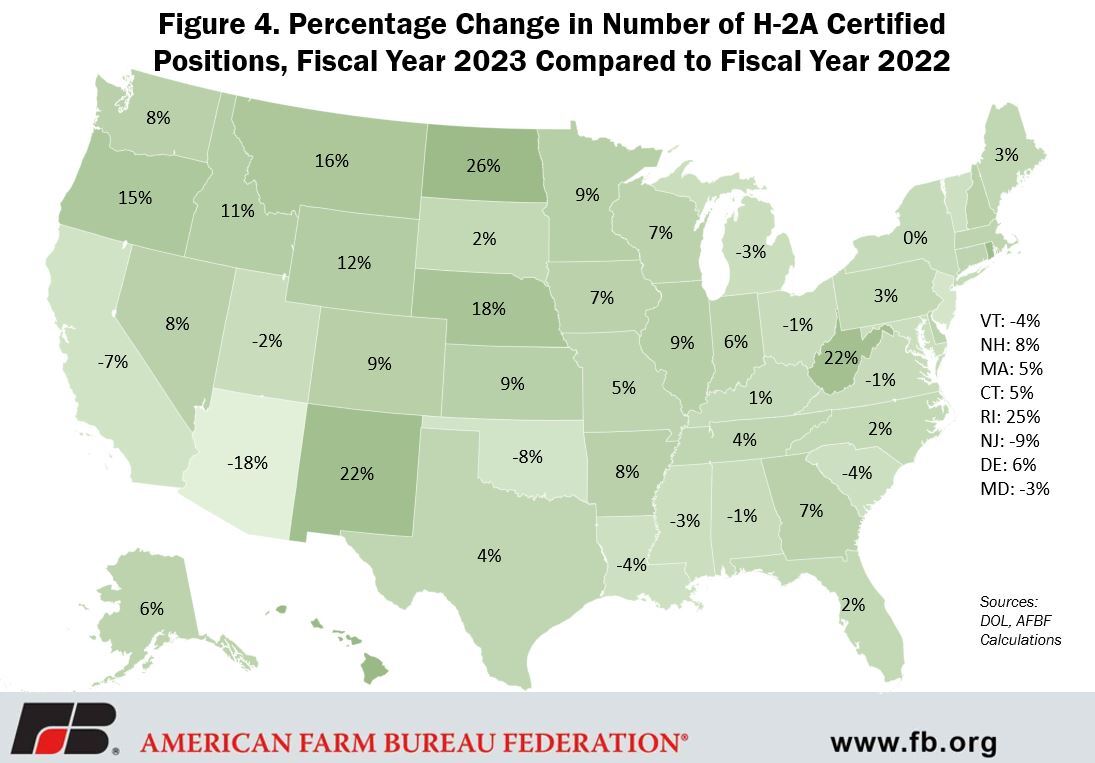
From the H-2A Disclosure Data for fiscal year 2023, we know that the number of certified positions increased in 37 states and decreased in 14 of the 51 states and territories. This was down from fiscal year 2022, in which there were increases in 48 states, no change in one and a decrease in two of the 51 states and territories. Washington (up 2,631), Georgia (up 2,562) and Florida (up 1,014), all top 10 states, had the largest increase in certified positions, but the third (North Dakota, up 714), fourth (Idaho, up 711), fifth (Nebraska, up 607), sixth (Oregon, up 573) and seventh (Arkansas, up 526) largest-increase states are not among the top 10 H-2A-utilizing states. Despite a national growth rate in certified positions of just 2%, 11 states and territories had double-digit growth rates in fiscal year 2023 compared to fiscal year 2022.
It is also worth noting that in addition to growth in the number of certified positions in fiscal year 2023, there was also a 10.5% increase in number of H-2A applications that were filed. This suggests that the number of operations that are utilizing the program is also growing, rather than the growth coming strictly from existing operations. The average number of certified positions per application in fiscal year 2023 was 20, which is down two positions from fiscal year 2022.
This new record usage of the H-2A program was in spite of a record-high U.S. Adverse Effect Wage Rate – the rate most users of the program pay workers. In calendar year 2023, the U.S. average AEWR was $17.55, up 6.8% from 2022. The 2024 AEWRs were revealed on Nov. 22 when USDA released the Farm Labor Report . At $17.55, the national average 2024 AEWR breaks the previous record by 93 cents per hour. Read more of our analysis of the 2024 AEWRs here.
Conclusion
The incredibly tight labor market is taking its toll on businesses across industries. Continued growth in the H-2A program across a wide geography, despite rapidly accelerating AEWRs, is a strong indication that the U.S. agricultural sector has been particularly hard hit. For a growing number of operations, the H-2A program is the only viable option for staffing their seasonal on-farm jobs.
Top Issues
VIEW ALL