USDA Data Reveals Shifts in Food Purchasing Behavior

photo credit: Alabama Farmers Federation, Used with Permission
Daniel Munch
Economist
A lot happens between when a crop is harvested or a cow is milked and when a consumer sits down for breakfast. Generational trends influence how and where people enjoy eating and the convenience of accessing and transporting food shifts how farmers and ranchers market their goods and build relationships with processing facilities and retail outlets. Market-moving events, like COVID-19 or rising inflation, disrupt these trends and have often exposed new or unexpected avenues for consumption. This article reviews the latest food expenditure data with an eye on consumption trends important to maintaining food business competitiveness in the modern marketplace.
USDA-Economic Research Service’s (ERS) Food Expenditure Series tracks the value of the U.S. food system by reporting on total food and beverage spending. This spending data is categorized as food consumed at home or food consumed away from home, such as at restaurants or hotels. For both the food at home and food away from home categories, spending is broken down further by the type of retail or food service outlet from which food and beverages were purchased.
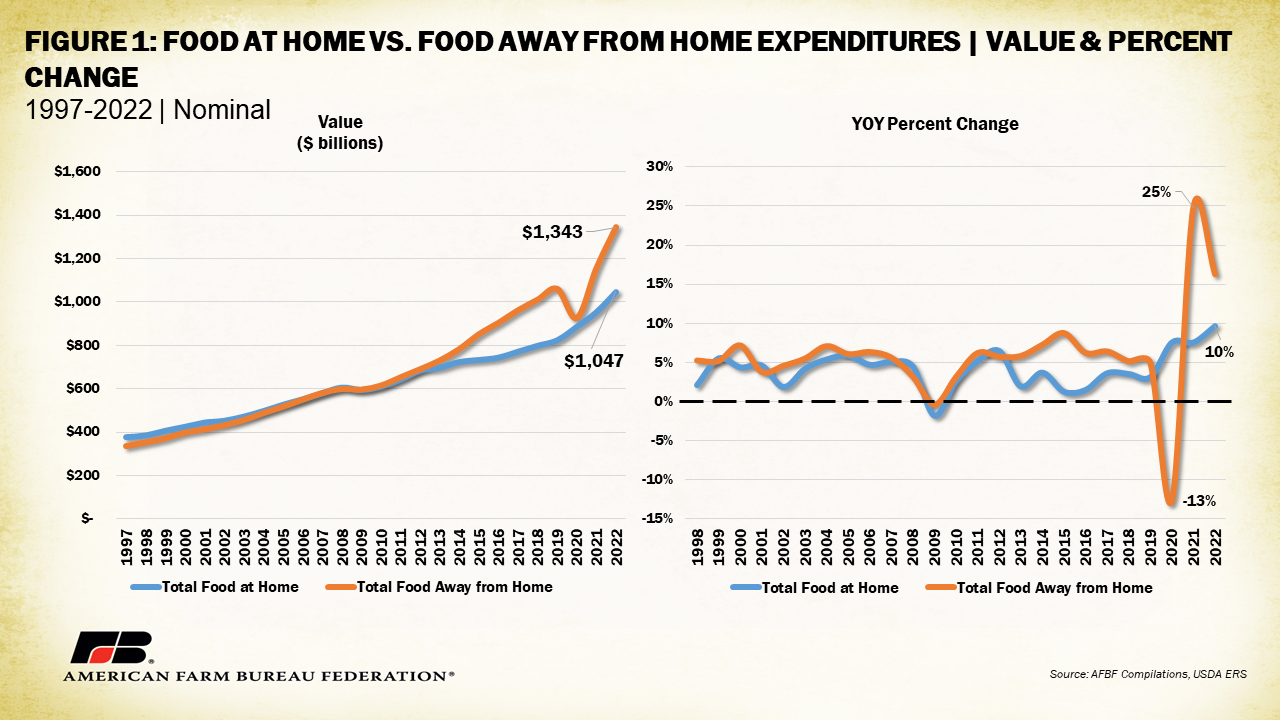
Between 1997 and 2022 total nominal spending on food at home increased from $376 billion across the nation to $1.047 trillion, a 178% increase and an average annual increase of 4%. During the same timeframe, food away from home increased from $336 billion to $1.343 trillion, an almost 300% increase and an average annual increase of 6%. Between 1997 and 2022, the consumer price index for food increased 95%, meaning inflation explains much of the increase in food spending across both categories, though there are other factors. Total food away from home spending has surpassed food at home spending since 2007, except for a flip in 2008 during the onset of the Great Recession.
Since 2015, food away from home spending has exceeded food at home spending by over $100 billion, except during 2020 when COVID-19 lockdowns prevented many consumers from consuming food in public settings. Between 2019 and 2020 food at home spending increased 8% while food away from home spending dropped 13%, the largest drop in the data series. The reopening of many food service outlets in 2021 and 2022 rebounded food away from home spending 25% and 15%, respectively. Before 2010, food away from home spending increased 5% annually compared to 4% for food at home. After 2010, food away from home spending increased 7% annually compared to 4% for food at home. Removing the 2020 COVID-19-linked outlier pushes average annual food away from home spending increases to 9%.
These trends are not surprising to many of us as restaurants and quick service options have played an increasing role in U.S. consumption culture. As convenience and time savings drive purchasing behavior, many of us prefer to grab a bite at a restaurant or through takeout options than to cook for ourselves. While the cost of many restaurant meals exceeds that of home-cooked recipes, the growth in low-cost, quick service options has lowered the cost barrier for consumers, further contributing to growth in spending away from home. While COVID-19 lockdowns revived at home consumption and cooking a bit, away from home spending in 2022 surpassed home spending by nearly $300 billion, the highest recorded margin.
Food at Home
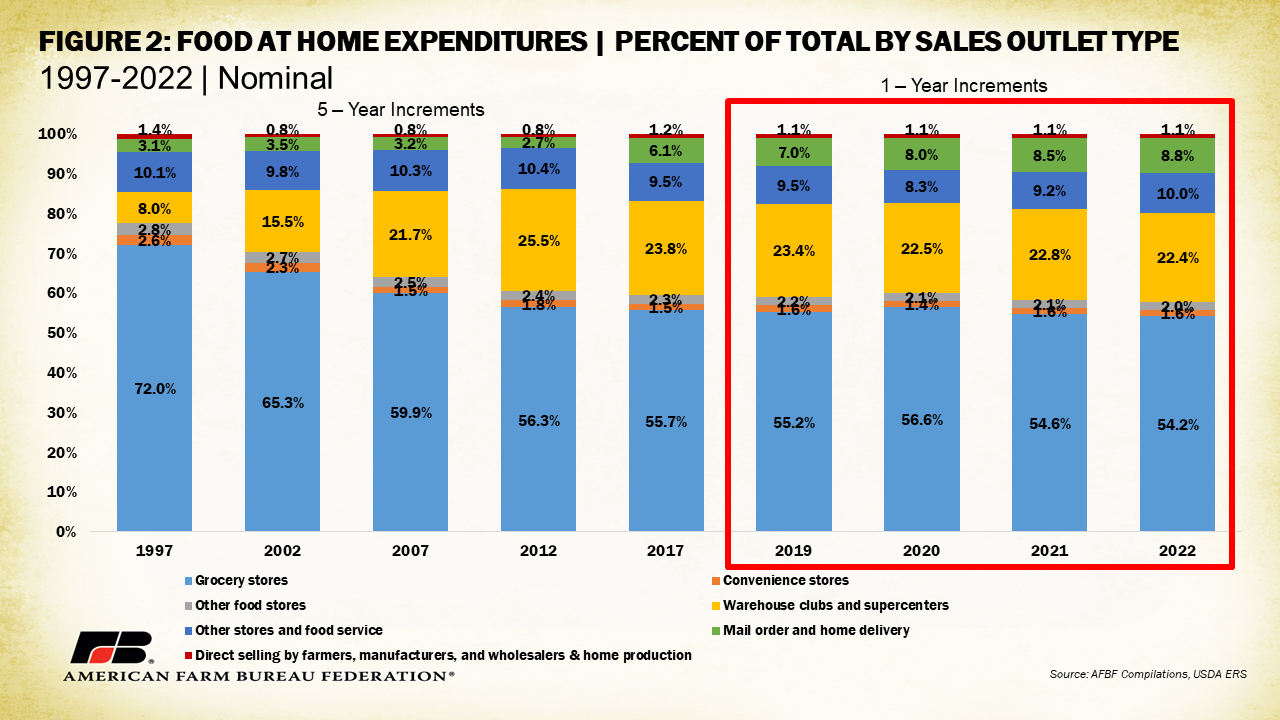
For food consumed at home, grocery stores have consistently captured the largest market share, though this share has decreased significantly. In 1997, grocery stores accounted for 72% of food at home expenditures. This dropped to 65% five years later in 2002 and to under 60% in 2007. In 2022, grocery stores took up 54.2% of at home food spending. The only time grocery stores’ market share has increased since 1997 is between 2019 and 2020, a likely result of people returning to grocery outlets amid lockdowns. Much of the decline in grocery store market share for at home spending has been the growth of warehouse clubs and supercenters and home delivery. Including popular bulk shopping centers like Costco and Sam’s Club, this category increased its market share from 8% in 1997 to 25.5% in 2012. Consumers have been attracted by the cost savings of buying in bulk, especially those supporting larger families, contributing to the growth of the warehouse segment. Bulk shopping centers’ over-a-quarter-of-the-market capture was then reduced by the entry of popular home delivery options between 2012 and 2017. In 2012, home delivery spending made up only 2.7% of at home food spending; by 2017 that share had risen to 6.1%. In 2022 warehouses and supercenters claimed 22.4% of food at home expenditures and mail order and home delivery claimed 8.8%. Interestingly, the value of food at home purchased directly from farmers, manufacturers and wholesalers and through home production has hovered between 0.8% and 1.4% with little visible trend.
These trends are further revealed in dollar value increases. Between 1997 and 2022 food expenditures at grocery stores increased from $270 billion to $567 billion, a 109% increase. During the same period, spending at warehouse clubs and supercenters grew from $30 billion to $234 billion, a 679% increase. Similarly, spending on food delivery increased 684% from $11 billion in 1997 to $91 billion in 2022. In a consumer environment where convenience is king, it is likely delivery food expenditures will only increase, though a recessionary period could drive a return to money-saving options. Other innovative at home food options could alter these trends.
Food Away from Home
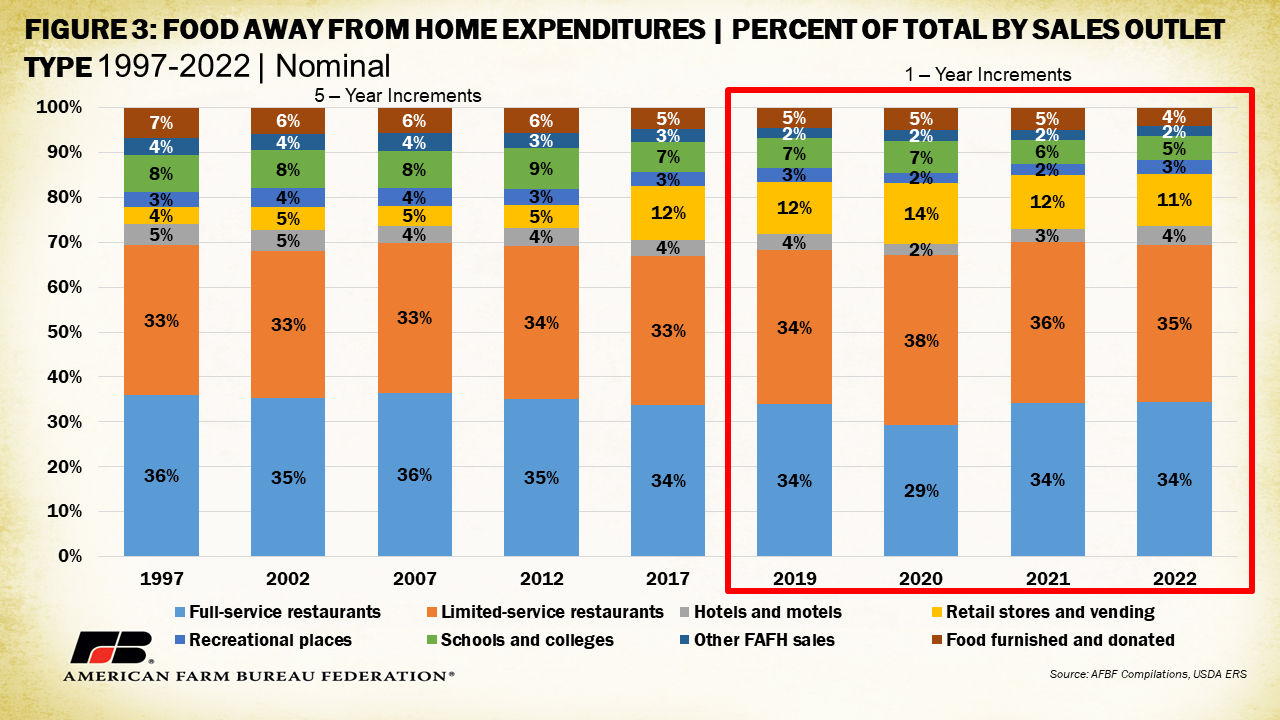
For food consumed away from home, limited-service restaurants and full-service restaurants have fought for the top market share spot in terms of spending. Limited-service restaurants include outlets where customers typically order and pay in advance at a counter and guest-server interaction ends when the food is provided. This includes most fast-food restaurant favorites like McDonald’s, Taco Bell, and Subway, as well as fast-casual dining like Panera or Chipotle. Full-service restaurants include your traditional sit-down experience where waitstaff provide service from taking your order to receiving payment, as well as catering services. Both outlet types had an average market share of 34% of food spent away from home between 1997 and 2022. The largest difference in these two categories occurred between 2019 and 2020 when limited-service restaurants claimed 38% of food away from home spending and full-service 29%, again linked to the COVID-19 lockdowns. Limited-service restaurants were able to take advantage of their structure, which reduces touch points between customers and employees. Drive-through options, app ordering and pickup availability are a few structural advantages many limited-service restaurants already had in place before restrictions went into effect. These dynamics buffered losses compared to full-service restaurants.
Food purchased and consumed at retail outlets or through vending machines has had the largest increase in market share. Making up only 4% of away from home expenditures in 1997, this category hit its peak in 2020 at 14% and made up 11% of away from home spending in 2022. Many retail outlets historically specializing in just merchandise sales have attempted to diversify income streams by offering in-store food consumption or take-away options. Technological innovations have also improved and diversified the range of products and storage of products in vending machines, which are increasingly used to sell food. Both of these factors have contributed to the growth in this category.
In dollar terms, between 1997 and 2022 food expenditures have increased from $120 billion to $462 billion at full-service restaurants (a 283% increase). Limited-service restaurant spending has increased from $112 billion to $468 billion (a 317% increase). During the same period, spending at retail stores and vending has increased from $11 billion to $154 billion, a 1,114% increase. Much consideration will be given to whether or not the experience of a full-service restaurant is able to offset the cost benefits and convenience of competing options, factors heavily linked to the cash access of consumers.
Regional Considerations
Food spending behavior also varies by state and region. Per capita food at home spending was highest in Maine ($3,860), New Hampshire ($3,248), Iowa ($3,103) and Colorado ($3,064) and lowest in Arkansas ($1,920), South Dakota ($1,997) and Mississippi ($2,007). Much of the at home spending distribution by state appears to be to a combination of average food prices in a state and a cultural preference for eating at home. Maine and New Hampshire, for instance, have high rural populations and high food prices, likely contributing to a higher percentage of people eating at home at a higher cost. Iowa is a bit of an outlier in its third-place spot for at home expenditures given its neighbors like South Dakota are much further down the list. This may be explained by a cultural preference to eating at home very frequently. Likewise, New York and Hawaii have high comparative food costs but show up in the bottom 10 states for food at home spending, likely linked to a cultural preference for eating away from home in more urbanized and tourist-heavy economies.
These hypotheses are further supported by distribution of away from home spending. Washington, D.C., ranks the highest in annual per capita spending on food consumed away from home ($4,774), followed by Hawaii ($3,860), Nevada ($3,637) and Colorado ($3,586). The lowest away from home spending states were Mississippi ($2,030), West Virginia ($2,080) and Arkansas ($2,109). Again, the regional price of food plays a role as well as commerce characteristics. Nevada’s heavily trafficked Las Vegas attractions likely account for comparatively high away from home spending. Florida, with a heavy tourism, away-from-home eating influence was in the top five as well. Each state’s and region’s characteristics contribute to how food is marketed and transported and requires producers to adjust business strategies accordingly.
Conclusions
How and where shoppers purchase food impacts the way in which food is transported, stored, packaged, prepared and ultimately consumed. Shifts in these conditions linked to local and global economic conditions, as well as preference changes, introduce uncertainty for those attempting to establish marketing strategies. Recent spending trends reveal a continued desire for convenience in eating experiences, favoring options that save time and money. Future higher cash access for consumers may shift food consumption toward immersive full-service away-from-home experiences. This would contrast with the COVID-19 contact-sensitive environment that demanded fewer contact points between the public. A future with lower cash access and negative economic indicators would lead to a continued trend demanding low-cost and low time-intensive options. In any case, farmers and ranchers must remain aware of consumer preferences in the way they purchase food in order to optimize market access and revenue-generating potential.
Top Issues
VIEW ALL