We Can’t Rearrange These Deck Chairs
TOPICS
Trade
photo credit: AFBF Photo, Morgan Walker
John Newton, Ph.D.
Vice President of Public Policy and Economic Analysis
The success of the U.S. soybean industry has largely been tied to China. In the two decades since China joined the World Trade Organization, U.S. soybean exports nearly doubled to more than 2 billion bushels during the 2017-2018 marketing year and soybean acres planted expanded by 15 million acres, or 20%, to 90 million acres planted in 2018.
For the past year and a half, however, U.S. soybeans have been subject to retaliatory tariffs by China. Not only that, but China has suffered a devastating outbreak of African Swine Fever, which has decimated over 30% to as much as 50% of the world’s largest hog population (African Swine Fever Outbreak in China, African Swine Fever and China: Part II and African Swine Fever in China Keeps Getting Worse). Reducing demand, driving down prices and pushing up stockpiles, these events have roiled U.S. soybean markets. In 2019, soybean planted acres fell to the lowest level since 2011, 76.5 million acres.
Now, recently released data from USDA’s Global Agricultural Trade System provides an opportunity to review the combined impact of retaliatory tariffs and African Swine Fever on U.S. soybean exports for the 2018-2019 marketing year – the first full crop year for tariffs and ASF.
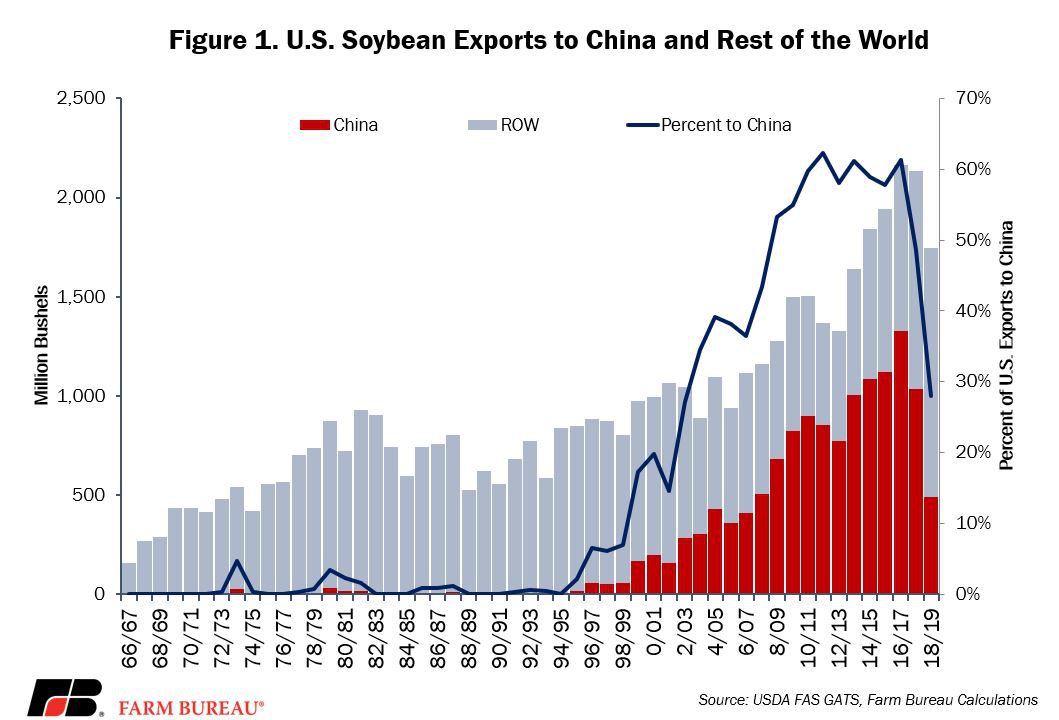
For the 2018-2019 marketing year, U.S. soybean exports totaled 1.748 billion bushels, the lowest level since the 2012-2013 marketing year and down 18%, or 386 million bushels, from prior-year levels. China remained the United States’ largest buyer, importing 489.5 million bushels, or 28% of the U.S. exports. However, exports to China fell by 53% or 546 million bushels from prior-year levels. Exports to China during the 2018-2019 marketing year were the lowest since the 2006-2007 marketing year. U.S. soybean exports to the rest of the world increased by 15%, or 160 million bushels, to 1.258 billion bushels, Figure 1.

Exports to Rest of the World
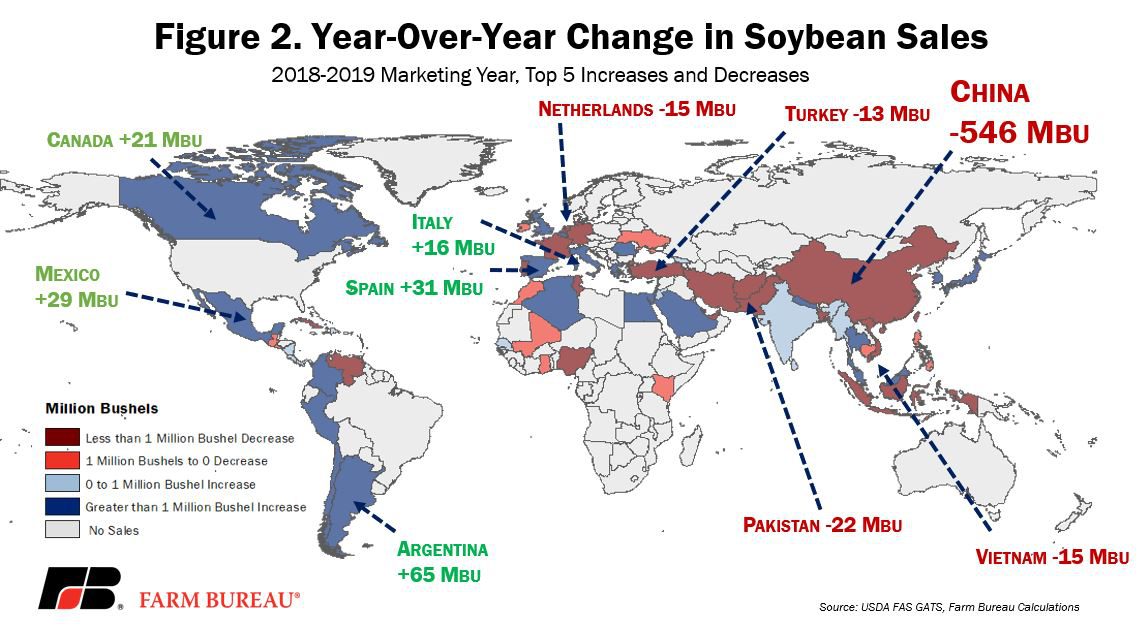
Some have claimed that purchases by other trading partners would offset the decline in soybean sales to China. For the 2018-2019 marketing year, the second-largest buyer of U.S. soybeans was Mexico at 190 million bushels. Exports to Mexico did jump 18%, or 29 million bushels, from prior-year levels, but they remained a very distant second to China.
Another noteworthy buyer of U.S. soybeans was Argentina – the world's third-largest producer of soybeans behind Brazil and the U.S. Argentina was hammered by a drought that reduced their soybean production by more than 30% and left many soybean crushing facilities under capacity, leading them to make up the shortfall with U.S. soybeans. During the 2018-2019 marketing year, Argentina purchased 73 million bushels of soybeans, up 873% from non-existent prior-year levels.
Led by a 31-million-bushel increase in Spain, a 16-million-bushel bump in Italy and a 14-million-bushel increase in Portugal, the European Union increased its purchases of U.S. soybeans by 33%, or 69 million bushels, to 278 million bushels. Sales to the Netherlands dropped by 15 million bushels, or 14%, from prior-year levels.
Over the last decade, China had purchased more than 60% of the soybeans traded globally. Given China’s outsized purchasing power, a considerable reduction in sales to that market is nearly impossible to offset by sales to other countries around the world. More directly, it’s not easy to rearrange the deck chairs in the soybean supply chain – as some have suggested. Figure 2 highlights the top five increases and decreases in year-over-year soybean exports.

Impact on Acreage
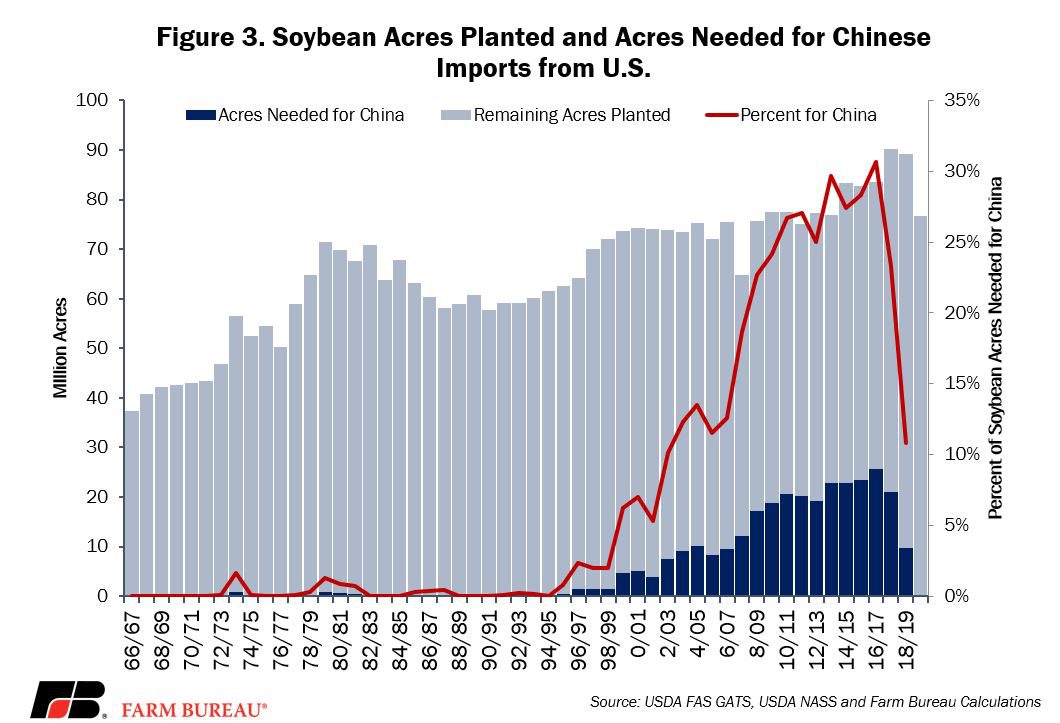
During the 2016-2017 marketing year, Chinese purchases peaked at 1.3 billion bushels of U.S. soybeans, representing one-third of every acre planted in the U.S. based on the national average crop yield. Now, however, with China reducing purchases by nearly 300 million bushels in 2017-2018 and another 546 million bushels this marketing year, fewer acres are needed to meet Chinese demand.
During the 2018-2019 marketing year, the 489 million bushels purchased by China could have been supplied by fewer than 10 million soybean acres – 11 million fewer acres than the prior year and 16 million acres fewer than two years earlier. This year, only 11% percent of U.S. soybean acres were needed to meet Chinese demand from the U.S., Figure 3.

U.S. farmers responded to the market signals, planting only 76.5 million acres, a substantial 12-million-acre drop from last year. As a result, soybean production is currently projected at 3.55 billion bushels, down 20%, or 878 million bushels, from last year – more than enough to offset the reduction in Chinese demand and help reduce the 453-million-bushel stockpile.
What’s Next?
For new-crop soybeans, USDA currently projects exports at 1.775 billion bushels – up 27 million bushels from the prior year. Through the first four weeks of the marketing year, USDA’s grain inspection data reveals soybean exports at 154 million bushels, up 27% from prior-year levels. Of the 154 million bushels inspected for export, 36 million bushels are destined for China – up from last year but down from the 93 million bushels shipped two years prior.
While inspections are up, commitments, i.e., accumulated and outstanding soybean exports, are down. USDA’s weekly export data shows total soybean export commitments at 602 million bushels through the first five weeks of the marketing year, down 20%, or 153 million bushels, from last year and down 34%, or 217 million bushels, from two years prior. Accumulated and outstanding sales to China currently total 176 million bushels through the first five weeks of the marketing year, up sharply from last year. Outstanding sales, i.e., not yet shipped, represent 143 million bushels and accumulated exports total 33 million bushels. China has returned, but it’s not necessarily business as usual.
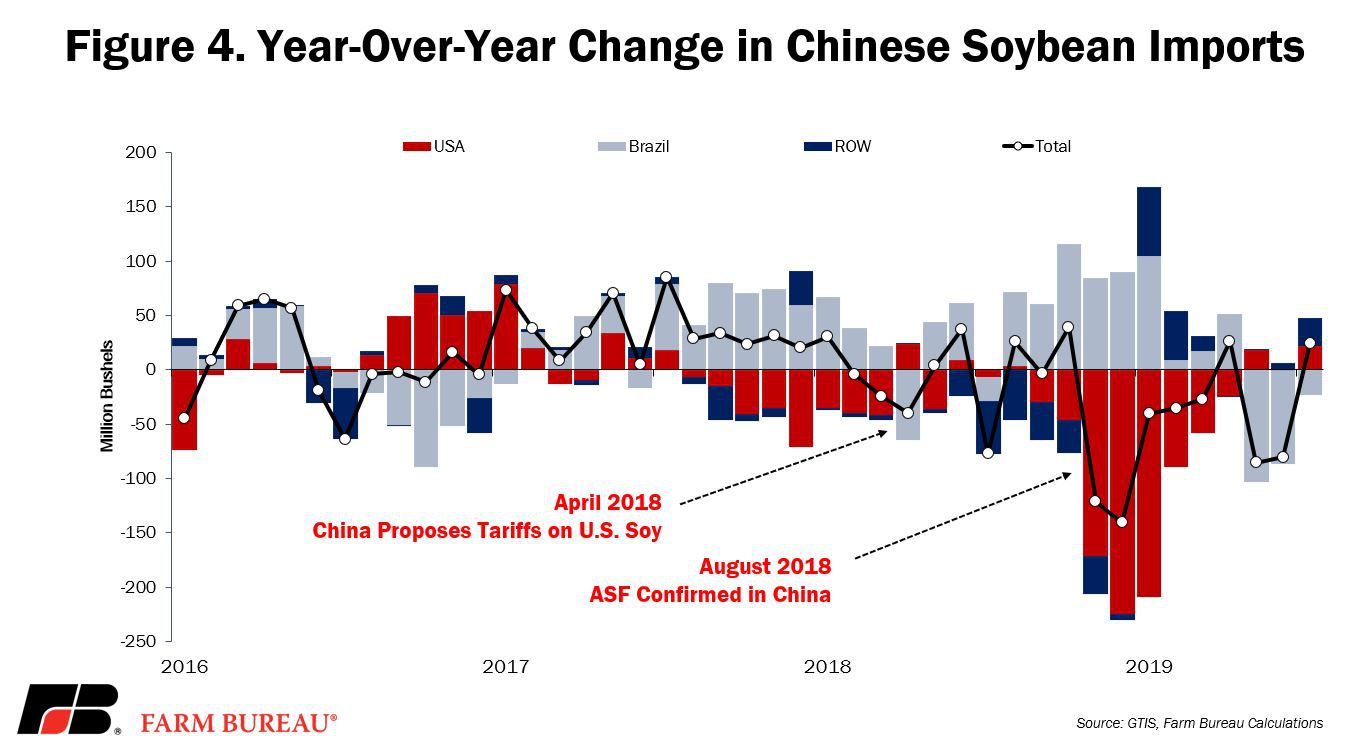
The bigger question now is not when the Chinese fully re-enter the U.S. market, but when they do, how much will they demand? Due to ASF, pork production is likely to fall sharply in the near term. This, in turn, will be accompanied by a reduction in demand for soybeans and soybean meal. Some have argued that the impact of ASF has done more to curb Chinese soybean demand than tariffs. As evidenced in Figure 4, while the Chinese substituted U.S. soybeans for Brazilian soybeans in late 2018 and into 2019, their overall import demand fell sharply.

Bolstered by increased production capacity and infrastructure investments, competitive South American suppliers are like to challenge the U.S market share in the short-run.
In the long-run, the business relationships that U.S. soybean producers and exporters have developed with Chinese importers over the decades will be an important component of regaining market share once free, and fair, trade resumes between the U.S. and China.
