Reviewing State-Level Farm Income and Production Expenses

John Newton, Ph.D.
Vice President of Public Policy and Economic Analysis
Key Takeaways
- USDA’s September Farm Sector Income Forecast provided the first state-level estimates for 2025 farm economic conditions. State-level projections were provided for gross farm income, production expenses and net farm income.
- A handful of states dominate farm income and expenses. California ($72 billion), Iowa ($47 billion), and Texas ($43 billion) led gross farm income, and the top 10 states accounted for more than half of both national gross income and production expenses.
- Net farm income is similarly concentrated. California ($26 billion), Texas ($15 billion), Iowa ($10 billion), and Nebraska (more than $8 billion) together made up over 30% of the national total and the top 10 states accounted for nearly 60% of U.S. net farm income.
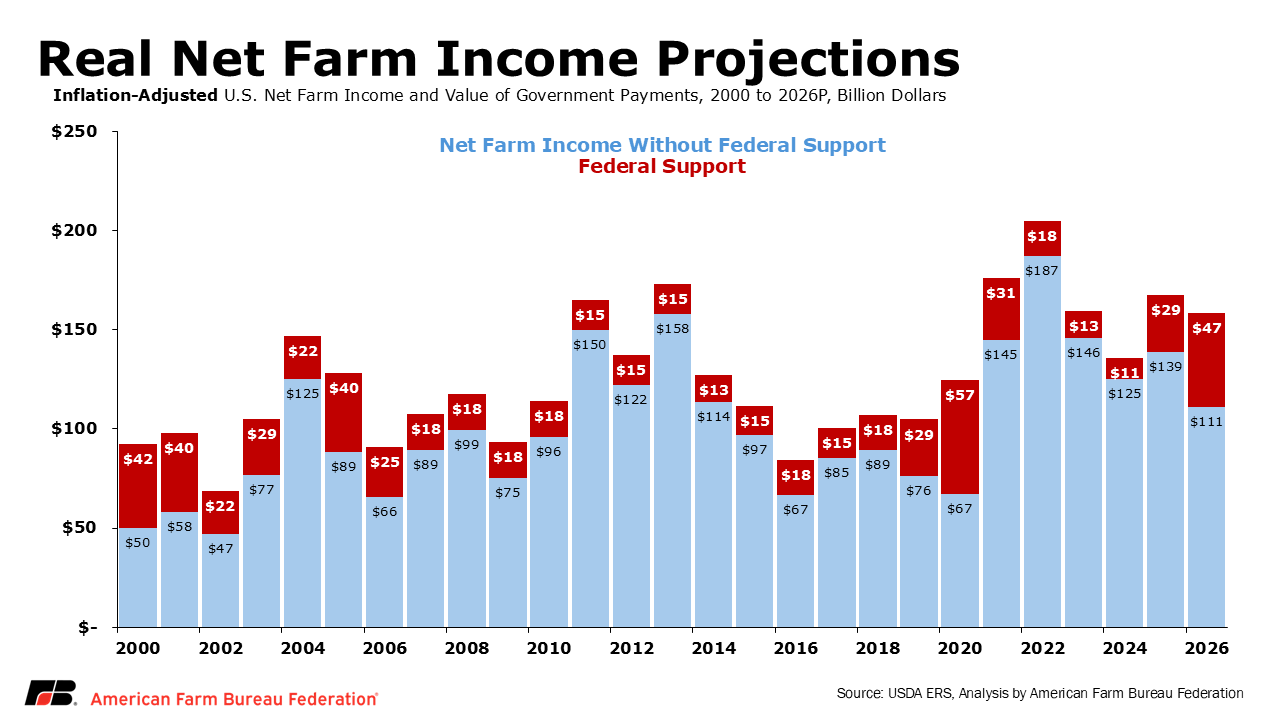
USDA’s September Farm Sector Income Forecast provided updated projections for 2026 farm income but also provided the first state-level estimates for gross farm income, production expenses and net farm income (a broad measure of overall farm profitability) for 2025. These updated forecasts revealed that during 2025 U.S. inflation-adjusted net farm income climbed by nearly $32 billion, or 23%, to $167 billion. This is increase was driven by record livestock-based cash receipts as well as ad hoc federal support from USDA’s congressionally approved programs authorized under the American Relief Act of 2025.
State-Level Gross Farm Income
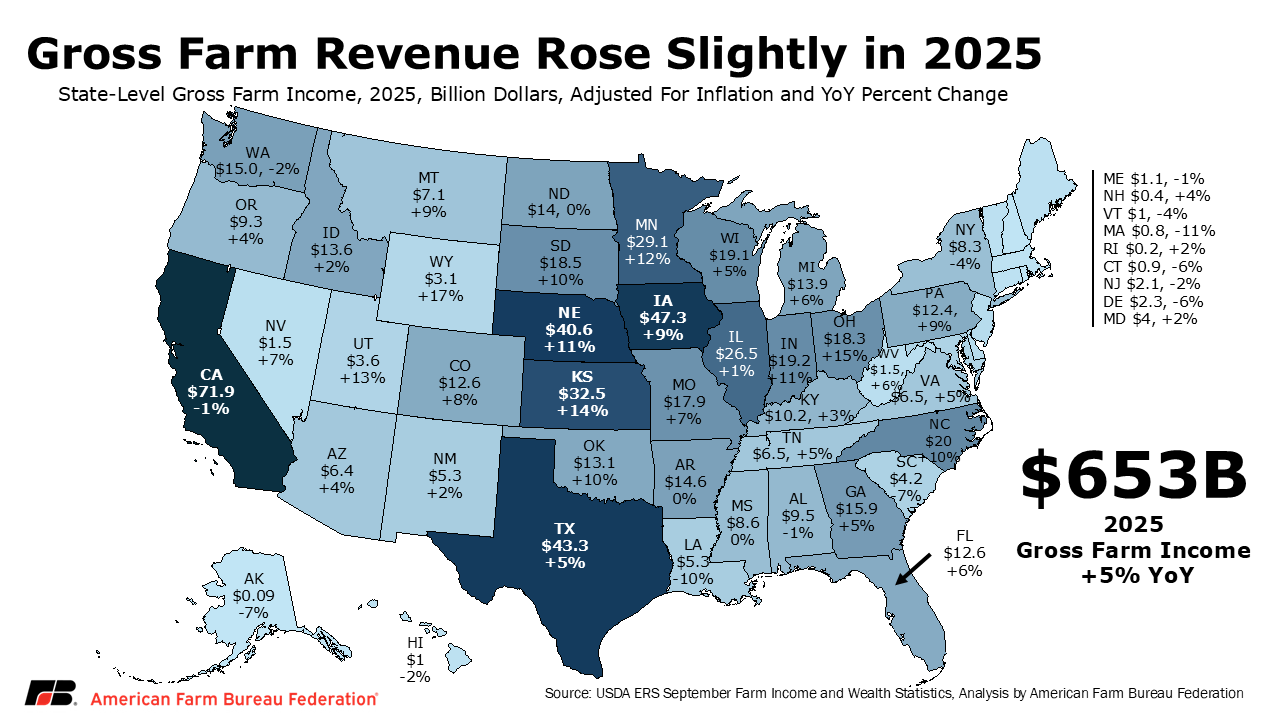
Buried beneath the headline net farm income projections for 2026, we find that inflation-adjusted U.S. gross farm income in 2025 is now forecast at $653 billion, an increase of 5%, or nearly $34 billion, from 2024’s inflation-adjusted value. As the nation’s largest agricultural producer, it is no surprise that California led the country with gross farm income of $72 billion in 2025, down only slightly from 2024’s estimate. Following California, Iowa was the nation’s second-largest contributor to real gross farm income at $47 billion – an increase of 9% year-over-year, attributable to higher cattle-based income and increased federal support compared to the year prior. Rounding out the top three, Texas contributed $43 billion to national gross farm income, and like Iowa was higher than 2024 due to livestock-based income and higher federal support.
Interestingly, the top 10 states in the U.S. in terms of agricultural income accounted for more than 50% of the nation’s real gross farm income. Rounding out the top 10 states in terms of real gross farm income are Nebraska ($41 billion), Kansas ($33 billion), Minnesota ($29 billion), Illinois ($26 billion), North Carolina ($20 billion), Indiana ($19 billion) and Wisconsin ($19 billion).
Production Expenses and Real Net Farm Income
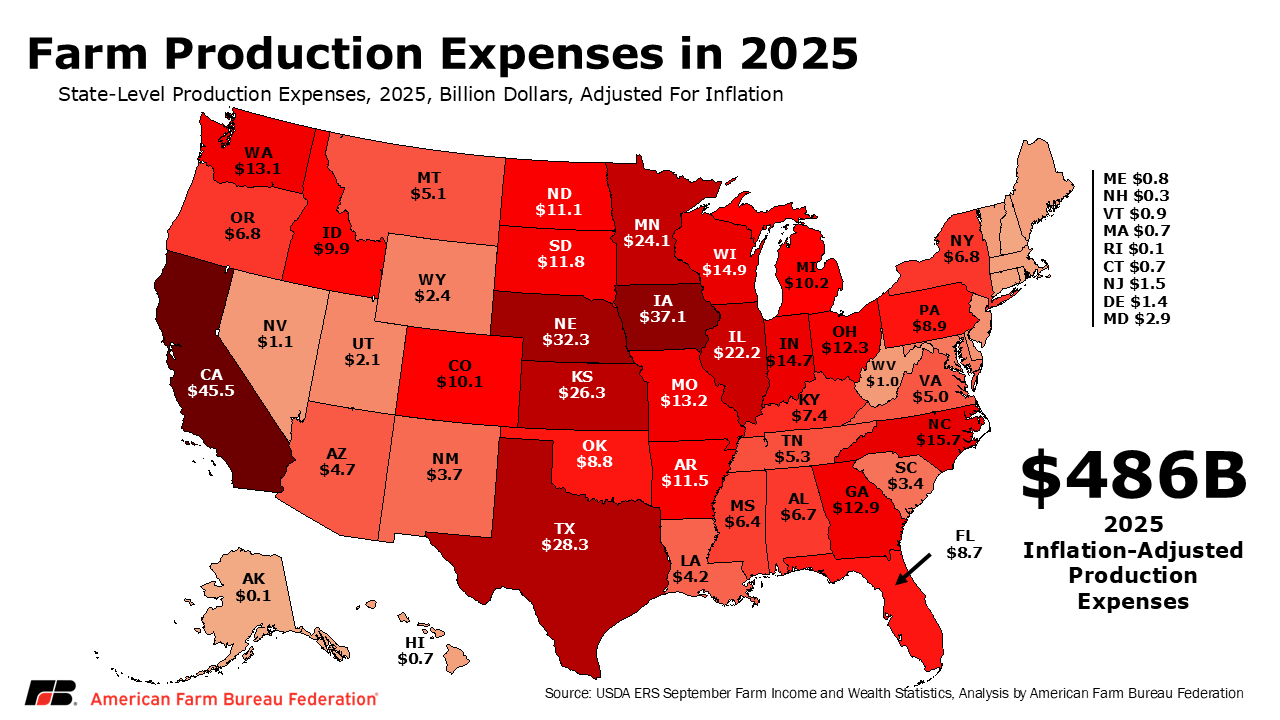
It’s no secret that input costs have continued to put pressure on farm income; as Congress and the administration have responded on two separate occasions to provide relief; first through ECAP and then through the Farmer Bridge Assistance program. During 2025, inflation-adjusted farm production expenses total $486 billion and were the highest in California, followed by Iowa, Nebraska and then Texas. Similar to revenues, the top 10 agricultural states in terms of production expenses, accounted for more than 50% of production expenses nationwide.
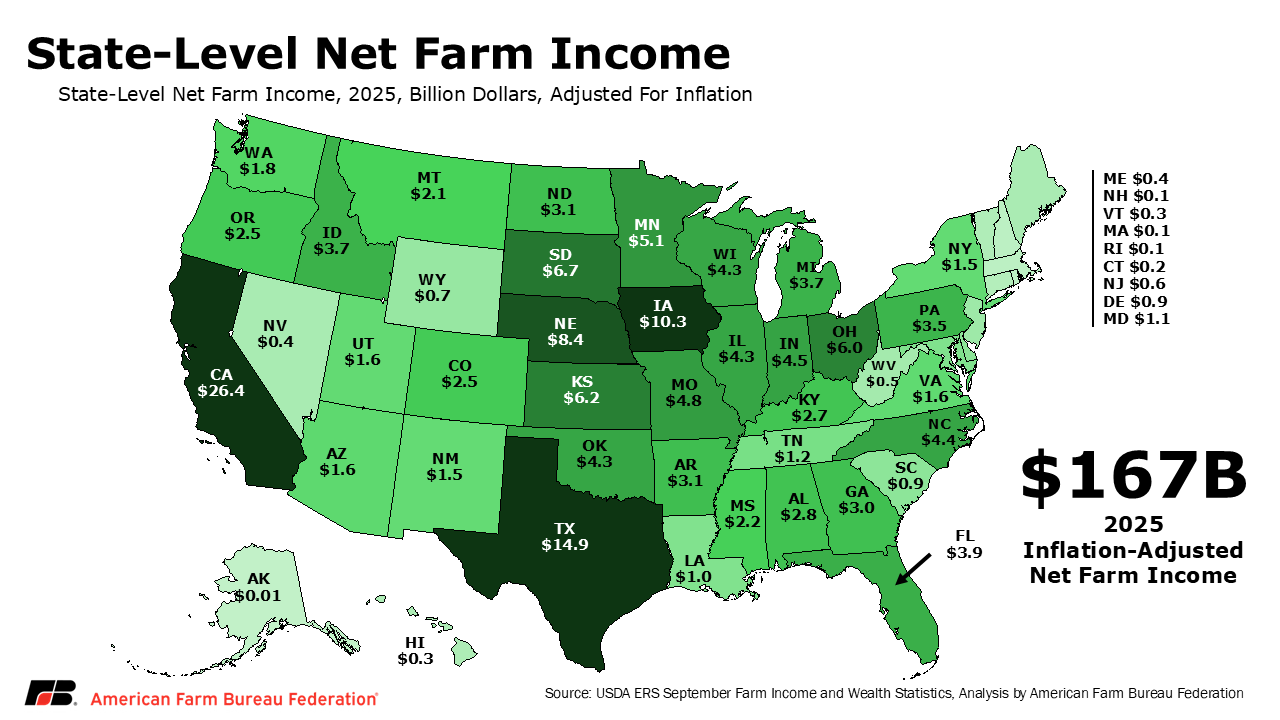
Inflation-adjusted net farm income, the difference between gross farm receipts and total production expenses, is a broad measure of the overall health of the farm economy. During 2025, inflation-adjusted net farm income totaled $167 billion and was up $32 billion from the prior year – again driven by strong returns in the livestock sector and increased federal support. Net farm income was the highest in California at $26 billion, followed by Texas at $15 billion, Iowa at $10 billion and Nebraska at more than $8 billion. These four states alone accounted for more than 30% of the nation’s net farm income in 2025.
Summary
USDA's September Farm Sector Income Forecast delivered the first state-level estimates of 2025 farm income, providing insight into the distribution of income, federal support, and production expenses across the U.S.
Gross farm income rose 5% to $653 billion, led by California at $72 billion, followed by Iowa at $47 billion and Texas at $43 billion, the latter two both supported by stronger livestock income and higher federal support. Importantly, the top 10 states generated more than half of the nation's gross farm income and accounted for more than half of production expenses. Net farm income was highest in California ($26 billion), Texas ($15 billion), Iowa ($10 billion), and Nebraska (more than $8 billion), which together accounted for over 30% of the national total.