Dairy Margin Coverage: A Vital Backstop Showing Its Limits
TOPICS
Dairy
Daniel Munch
Economist
Key Takeaways
- Dairy Margin Coverage (DMC) remains an essential base-layer safety net. The program has delivered more than $2.7 billion in net support since 2019 and exceeded $1 billion in payments in both 2021 and 2023, providing critical countercyclical protection during severe margin compression.
- Recent conditions expose structural limitations. Because DMC reflects only national feed costs, and not the cost of raising homegrown feed, it did not trigger payments for most of 2025, despite a $4 per cwt drop in the all-milk price and historically high costs of production for row crops.
- Non-feed inflation is eroding farm-level margins. Labor, veterinary, energy, capital recovery and other overhead costs, now up roughly 21% since 2021, are not captured in the DMC formula.
- Regional feed cost variation creates basis risk. Feed costs in certain states are routinely higher than the national benchmark used in DMC calculations.
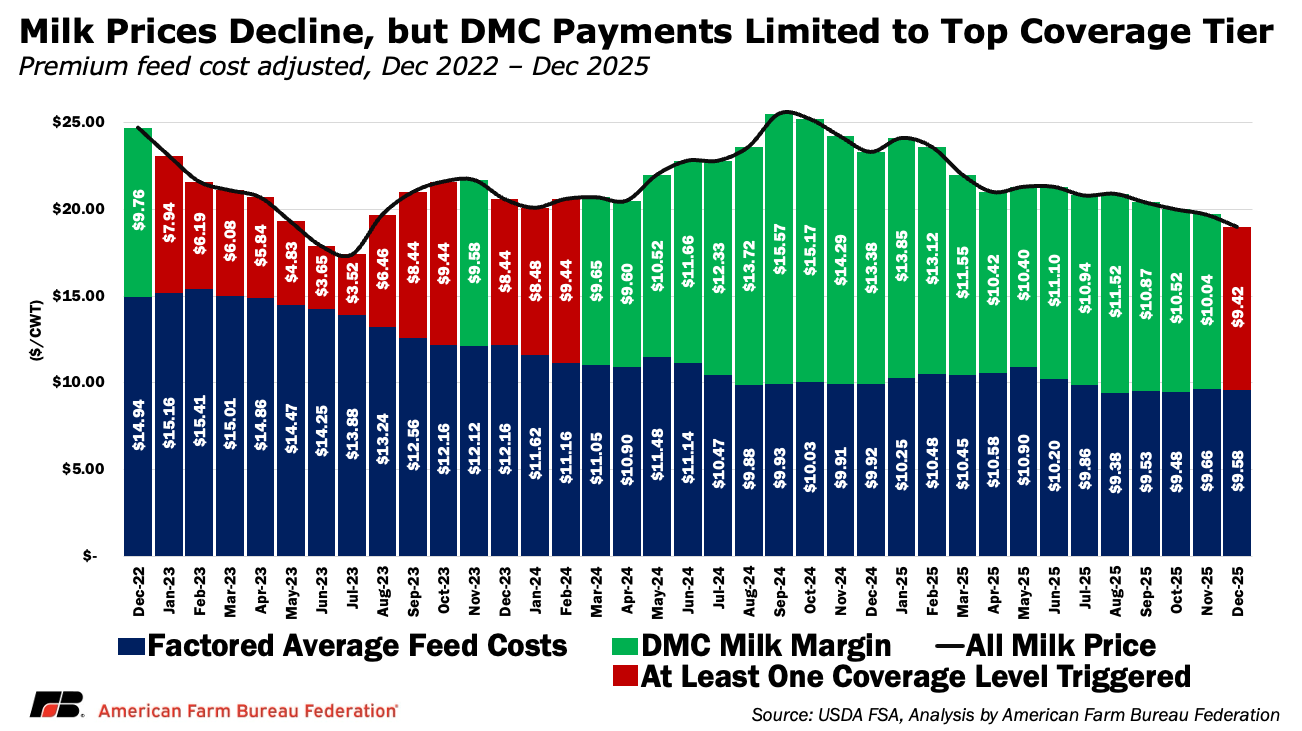
Milk markets have softened over the past year. The U.S. all-milk price averaged roughly $19 per cwt in December 2025, down more than $4 since January, while butter and cheddar prices fell 47% and 28%, respectively. Lower prices have improved export competitiveness, but for many dairy farmers, stronger trade has not translated into stronger cash flow from milk.
A $4 decline in milk prices normally suggests the safety net would engage. Yet over the past year and a half, Dairy Margin Coverage payments have been limited. The reason lies in the program’s design. DMC protects a national income-over-feed-cost margin, not total profitability. When milk prices and feed costs decline together, the margin can remain above trigger levels even as other operating expenses stay elevated.
This Market Intel examines why DMC has remained relatively quiet and what that reveals about how the program measures dairy risk.
How Dairy Margin Coverage Works and What Changed Under OBBBA
Dairy Margin Coverage is the federal government’s primary margin-based safety net for dairy farmers. The program pays when a calculated national margin (defined as the U.S. all-milk price minus a formula feed cost) falls below a producer’s selected coverage level. Coverage is available from $4 up to $9.50 per cwt for Tier I production. Historically, Tier I has been capped at the first 5 million pounds of a farm’s production history, with milk above that level eligible for lower maximum coverage under Tier II.
The margin itself is built from two national components: the U.S. all-milk price and a standardized feed cost based on corn, soybean meal and premium alfalfa hay prices. USDA calculates that margin each month and applies it uniformly across all enrolled operations. Importantly, the feed cost component reflects a standardized ration using national market prices. It does not account for the cost of producing homegrown feed on dairy farms. For operations that raise a substantial share of their own corn or forage, input costs such as seed, fertilizer, chemicals, fuel, land rents and machinery depreciation may rise even when national commodity prices decline. In those cases, the DMC feed formula can understate the true cost of feed production.
When the national margin for a month is below a producer’s elected coverage level, the payment rate for that month is the difference between the coverage level and the published margin, applied to the amount of milk covered by the program.
Beginning in 2026, several structural adjustments enacted in the One Big Beautiful Bill Act (OBBBA) will expand the program’s reach. Tier I coverage increases from 5 million pounds to 6 million pounds, allowing a larger share of milk to qualify for the highest and most affordable $9.50 protection. OBBBA also updates production history to allow farmers to use the highest production from 2021 to 2023 as a new enrollment baseline. Those who commit to multiyear (2026-2031) DMC coverage receive a 25% discount on premiums, encouraging long-term participation (for example lowering Tier I premiums at the $9.50 level from 15 cent per hundredweight to 11.25 cents). These changes expand access to the most cost-effective tranche of coverage, particularly for small and mid-sized dairies.
What OBBBA did not address was the margin formula itself. DMC remains a national income-over-feed-cost program that does not incorporate non-feed operating costs or adjust for regional variation in feed or milk prices. Because the program had delivered significant support during recent feed-driven downturns, structural changes to the margin calculation were not a central focus when OBBBA was being negotiated.
As a result, the national DMC margin remained above most coverage thresholds for much of 2024 and 2025. It was not until December 2025 that the margin slipped below $9.50 per cwt, triggering a payment at the highest Tier I coverage level of 8 cents per hundredweight. Dairy farmers enrolled at lower buy-up levels did not receive payments. This marked the first trigger at the highest coverage tier since early 2024, when a combination of elevated feed costs and depressed milk prices pushed margins below multiple thresholds — including breaching the catastrophic $4 level for the first time in program history in 2023.
Increasing Non-Feed Costs for Dairy Farmers
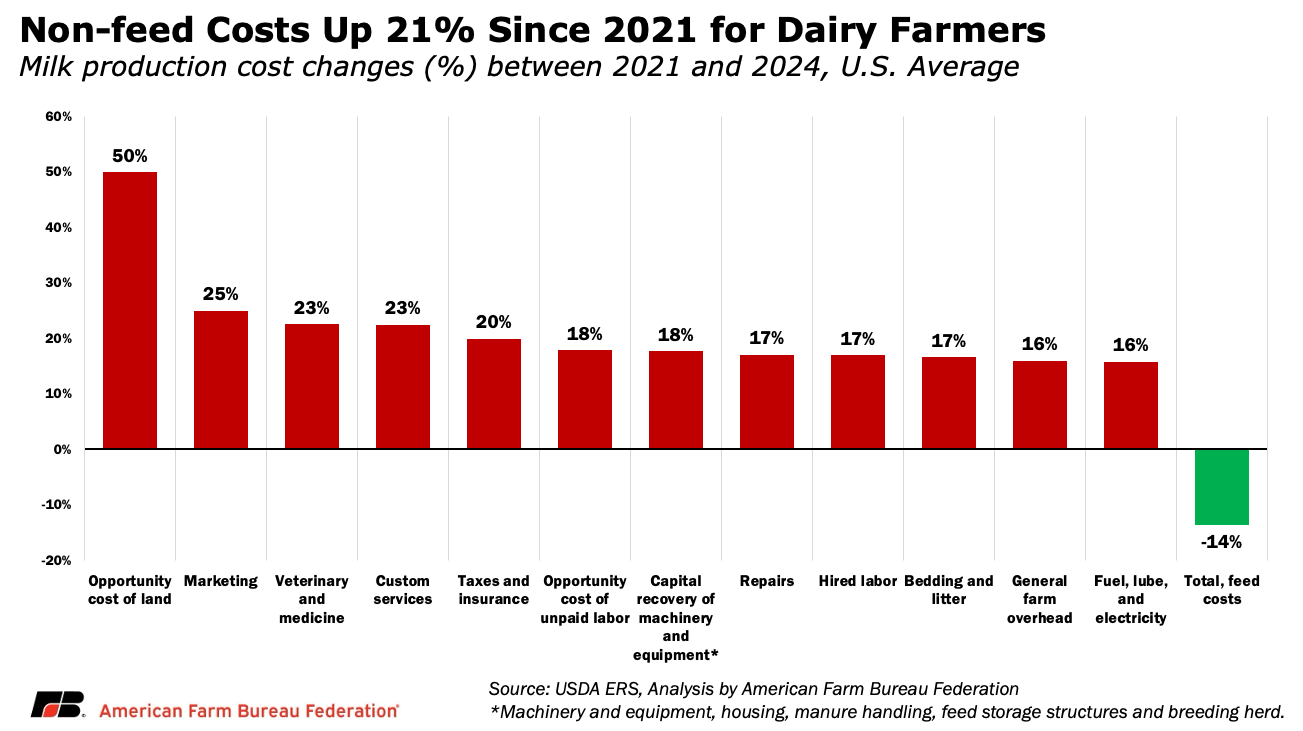
Since 2021, average non-feed milk production costs have risen roughly 21% nationwide. These increases span multiple categories, including labor, fuel and electricity, machinery and equipment, housing and manure handling infrastructure, interest expenses and breeding herd costs.
Unlike feed markets, which tend to move in clearer commodity cycles, many of these expenses have reset at structurally higher levels. Labor markets remain tight, capital costs reflect higher interest rates, and energy and repair expenses have not returned to pre-2021 levels. For operations carrying debt or that have recently expanded, higher financing and capital recovery costs compound that pressure. These higher costs also increase the opportunity cost of capital — the return producers could earn by investing their money elsewhere rather than tying it up in dairy production.
The cumulative effect is that even when feed costs moderate, overall production costs do not necessarily decline.
The Margin Gap: When Income Over Feed Cost Isn’t Enough
The core limitation of DMC becomes clearer when the national margin is placed alongside what dairies are actually paying to produce milk. In 2024, U.S. dairy producers faced average feed costs of roughly $10.31 per hundredweight and non-feed expenses of $13.34 per hundredweight, bringing total production costs to approximately $23.65 per hundredweight.
Under the DMC formula, however, feed costs are estimated differently. Using the program’s standardized ration, USDA calculated feed costs at $10.62 per hundredweight. With an all-milk price averaging $22.60 per hundredweight, the resulting national DMC margin was $11.98.
On paper, that $11.98 margin appears strong relative to the program’s $9.50 maximum Tier I trigger. But once non-feed costs of $13.34 per hundredweight are layered in, the picture changes. Those non-feed expenses alone exceed the entire calculated DMC margin, leaving little room for positive net returns even though the program does not trigger. In other words, the margin DMC measures can remain comfortably above coverage thresholds while full cost-of-production margins are razor thin or negative.
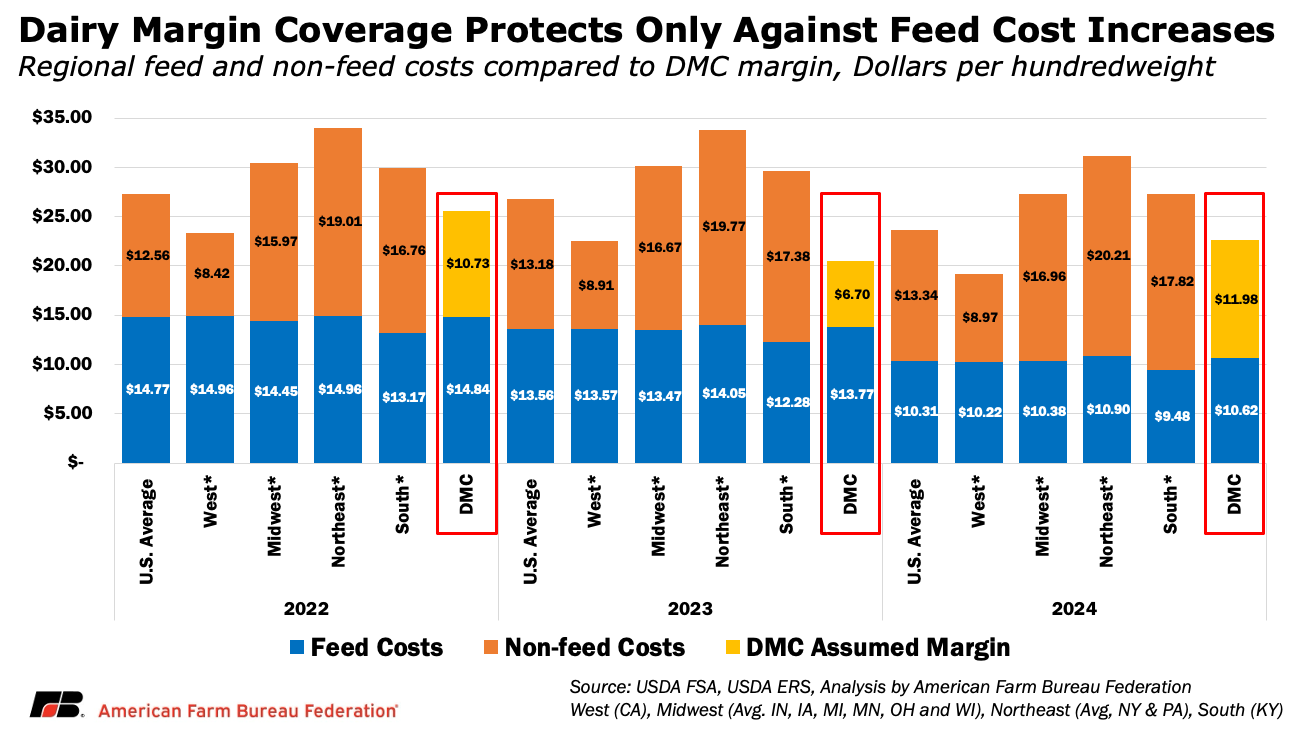
That gap is not uniform across the country either. Regional differences in feed markets, hauling distances, forage availability, labor markets and regulatory costs mean some dairies operate in structurally higher-cost environments than others. When local feed costs exceed the national benchmark embedded in DMC, or when overhead expenses are materially higher, the national margin can overstate the financial cushion available to those operations.
In 2024, estimated non-feed costs ranged from roughly $8.97 per hundredweight in the West (California) to as high as $20.21 per hundredweight in the Northeast (Pennsylvania and New York). In practical terms, a dairy in a higher-cost region may face negative full-cost margins even when the national DMC margin remains comfortably above trigger levels.
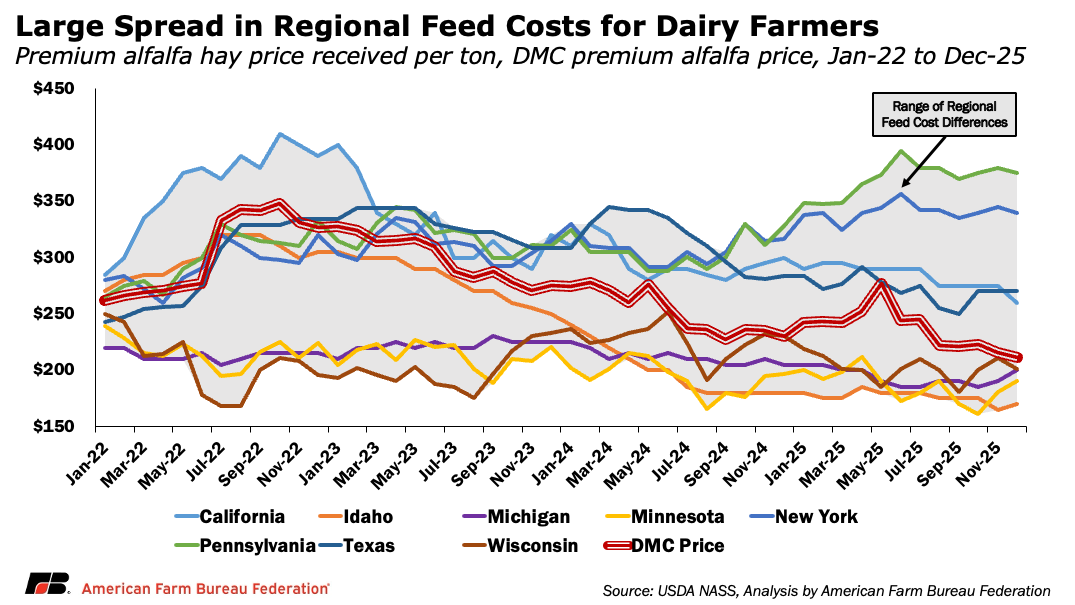
On the feed side, variation can be just as pronounced. Using premium alfalfa hay as an example, the national DMC feed formula averaged roughly $237 per ton in 2025. But that benchmark masked substantial regional differences. In Pennsylvania, average alfalfa prices were approximately $370 per ton, or 56%, higher than the DMC reference price. New York producers paid roughly $341 per ton, or 44%, above the benchmark. In contrast, states with larger alfalfa production, such as Minnesota and Wisconsin, saw prices come in 21% and 15% below the DMC benchmark, respectively.
Conclusion
Dairy Margin Coverage remains a critical pillar of the dairy safety net. When feed-driven margin compression hits, the program has proven it can deliver timely and meaningful support, as seen in the more than $2.7 billion in net payments since 2019 and the substantial relief provided in 2021 and 2023.
Recent conditions, however, underscore the limits of a national income-over-feed-cost formula in a sector where non-feed expenses and regional cost differences increasingly shape profitability. OBBBA strengthens participation beginning in 2026, but it does not alter how the margin itself is calculated.
As dairy cost structures evolve, maintaining a predictable margin-based backstop remains essential, particularly for the small and mid-sized producers the program most strongly supports. The longer-term policy question is whether targeted refinements to how the margin is calculated could improve responsiveness to market conditions while preserving the simplicity and transparency that have made DMC effective.
Top Issues
VIEW ALL