Rethinking Coverage Limits in Dairy Risk Programs

Daniel Munch
Economist
Key Takeaways:
- Most enrolled Dairy Margin Coverage (DMC) milk is at the program's Tier 1 ceiling. Ninety-eight percent of Tier 1 enrolled milk is at the $9.50 maximum coverage level, suggesting demand for protection beyond what the program currently offers.
- Lifting the Tier 1 ceiling would expand coverage in years when margins are compressed. Based on 2020-2025 margin history, an $11 ceiling would have triggered payments in 53 of 72 months, up from 41 months at $9.50, adding an average of 87 cents per hundredweight above the current maximum.
- The gap between coverage and costs is largest for small and mid-sized dairies. Farms with 50 to 499 cows face the highest per-unit costs and typically fall entirely within Tier 1, meaning they would fully benefit from expanded coverage at the program’s most affordable premium rates.
- Dairy Revenue Protection's (DRP) 95% coverage ceiling reflects a statutory limit, not a market preference. Ninety-four percent of all DRP liability is written at the 95% maximum. Livestock Risk Protection, reinsured by the same federal agency, is already authorized above 95% under a different provision of the same law.
- Raising both ceilings would strengthen the two primary tools dairy farmers use to manage risk. Lifting the DMC Tier 1 ceiling and expanding DRP coverage levels are targeted adjustments that would better reflect current production costs without redesigning either program's underlying formula. Without further changes, DMC coverage levels would remain unchanged through at least the 2031 farm bill, more than a decade after the current $9.50 ceiling was established.
DMC was designed to provide a financial backstop when the margin between milk revenue and feed costs compresses. Since its current form took effect in 2019, the program has delivered more than $2.7 billion in net support, including over $1 billion in payments in both 2021 and 2023. But DMC only measures what its formula captures: a national income-over-feed-cost margin. Labor, fuel, veterinary expenses, capital recovery and other overhead costs, which have risen roughly 21% since 2021, fall entirely outside the calculation. When feed costs ease but overhead remains elevated, the calculated margin can stay above trigger levels even as actual farm profitability deteriorates.
That structural gap shapes how farmers use the program. This Market Intel examines what lifting that ceiling in 50-cent option increments up to $12 would have meant for farmers over the past six years, and considers a parallel opportunity with DRP, where a statutory 95% coverage ceiling similarly constrains how much protection farmers can access.
How DMC is Structured
DMC pays farmers the difference between their selected coverage level and the national margin when that margin falls short. The program has two tiers of coverage, each serving a different portion of a farm's production history.
Tier 1 covers the first 5 million pounds of a farm's production history (raised to 6 million pounds under the One Big Beautiful Bill Act beginning in 2026). Coverage is available in 50-cent increments from $4 to $9.50, with premiums that rise with the coverage level selected, ranging from effectively zero at the catastrophic $4 level up to 15 cents per hundredweight at $9.50. Tier 1 is designed as the affordable foundation of the program, with premiums low enough to make buy-up coverage accessible for most operations.
Tier 2 covers production above the Tier 1 threshold, with coverage available between $4 and $8. Tier 2 premiums increase more steeply with coverage level, reaching as high as $1.813 per hundredweight at $8, which makes buying up to higher Tier 2 coverage levels cost-prohibitive for many larger operations. In practice, most Tier 2 production is enrolled at or near the catastrophic $4 level.
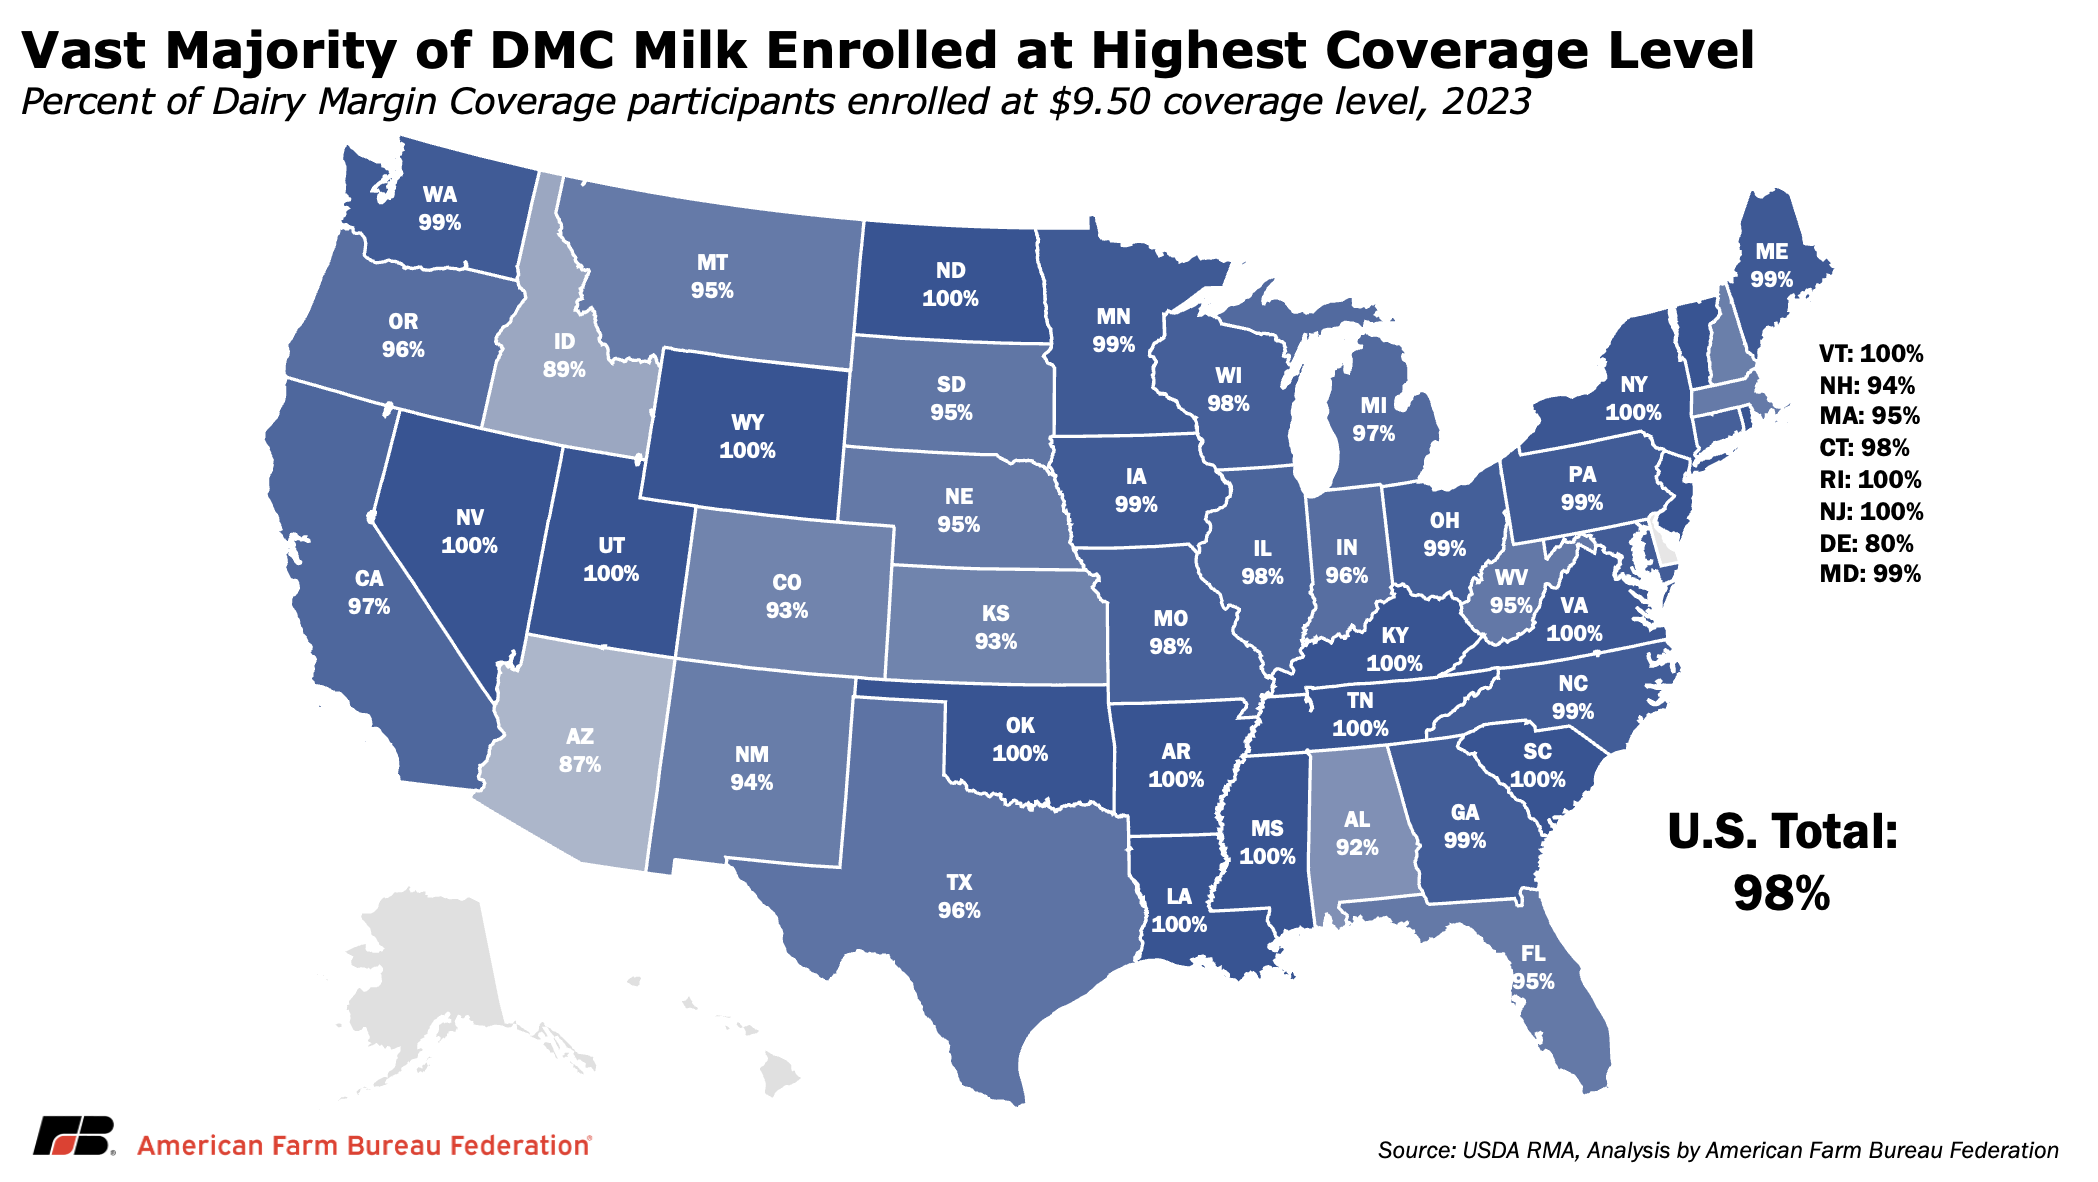
In 2023, 98% of all Tier 1 enrolled milk was at the $9.50 maximum coverage level. Most states were at 95% or higher; with several at 100% and only two below 90% (Arizona and Delaware). A distribution this concentrated at a single level is consistent with farmers hitting a ceiling rather than naturally converging on a preferred coverage amount. The data does not prove unmet demand but strongly signals it.
What a Higher Ceiling Would Have Meant
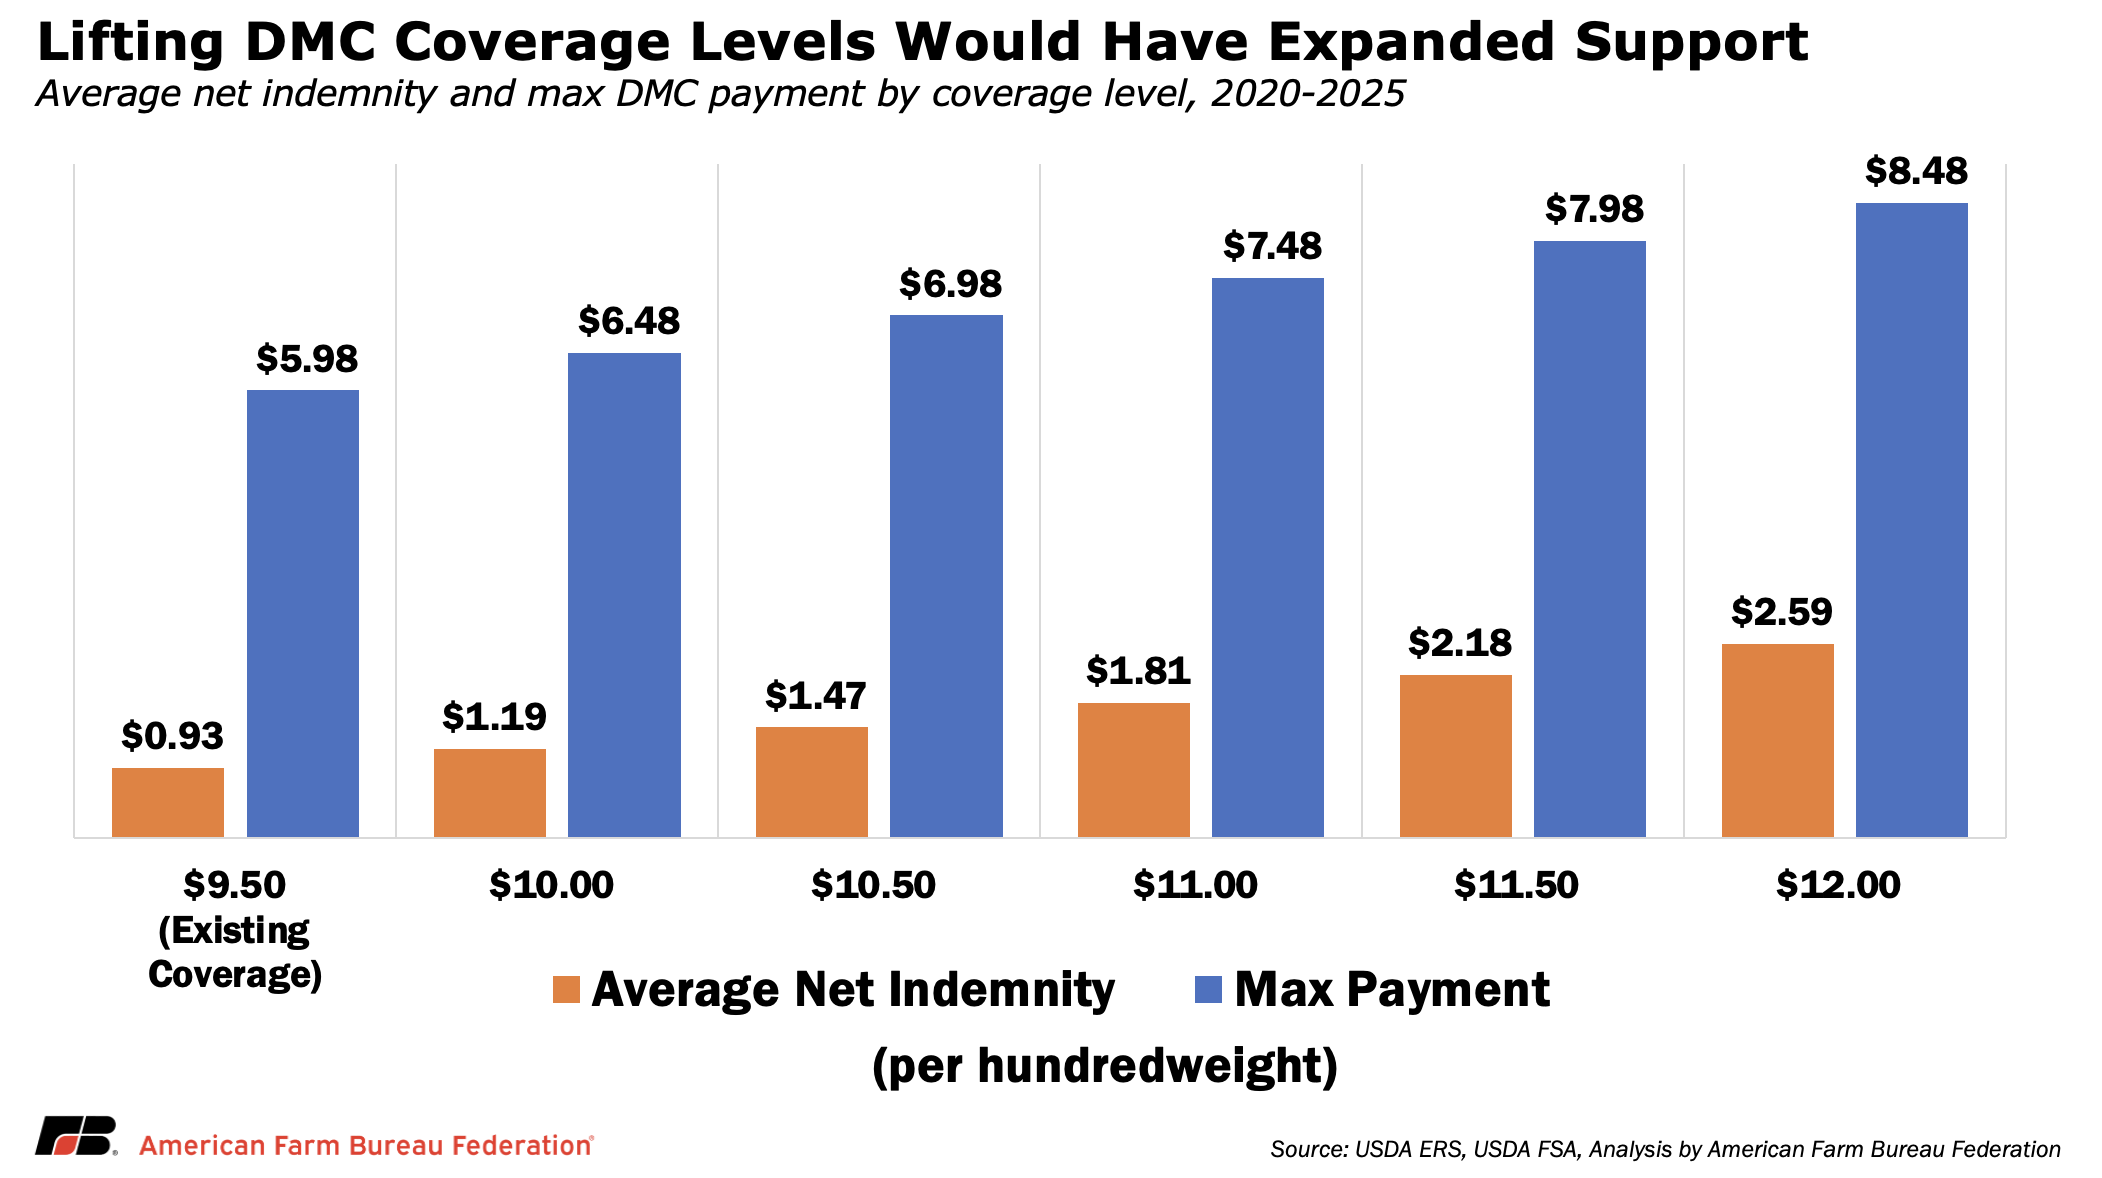
To put numbers on the potential impact, a historical analysis examined monthly DMC margin data from January 2020 through December 2025, a six-year window that includes high-loss years like 2021 and 2023 as well as relatively stable stretches in 2022 and 2024. At the highest level of existing Tier I coverage ($9.50), DMC triggered payments in 32 of 72 months, or 44% of the analysis period. A $10.50 ceiling would have added 12 more months. At $11, payments would have triggered in 53 months. At $12, coverage would have paid out in 61 of 72 months, or 85% of the period analyzed.
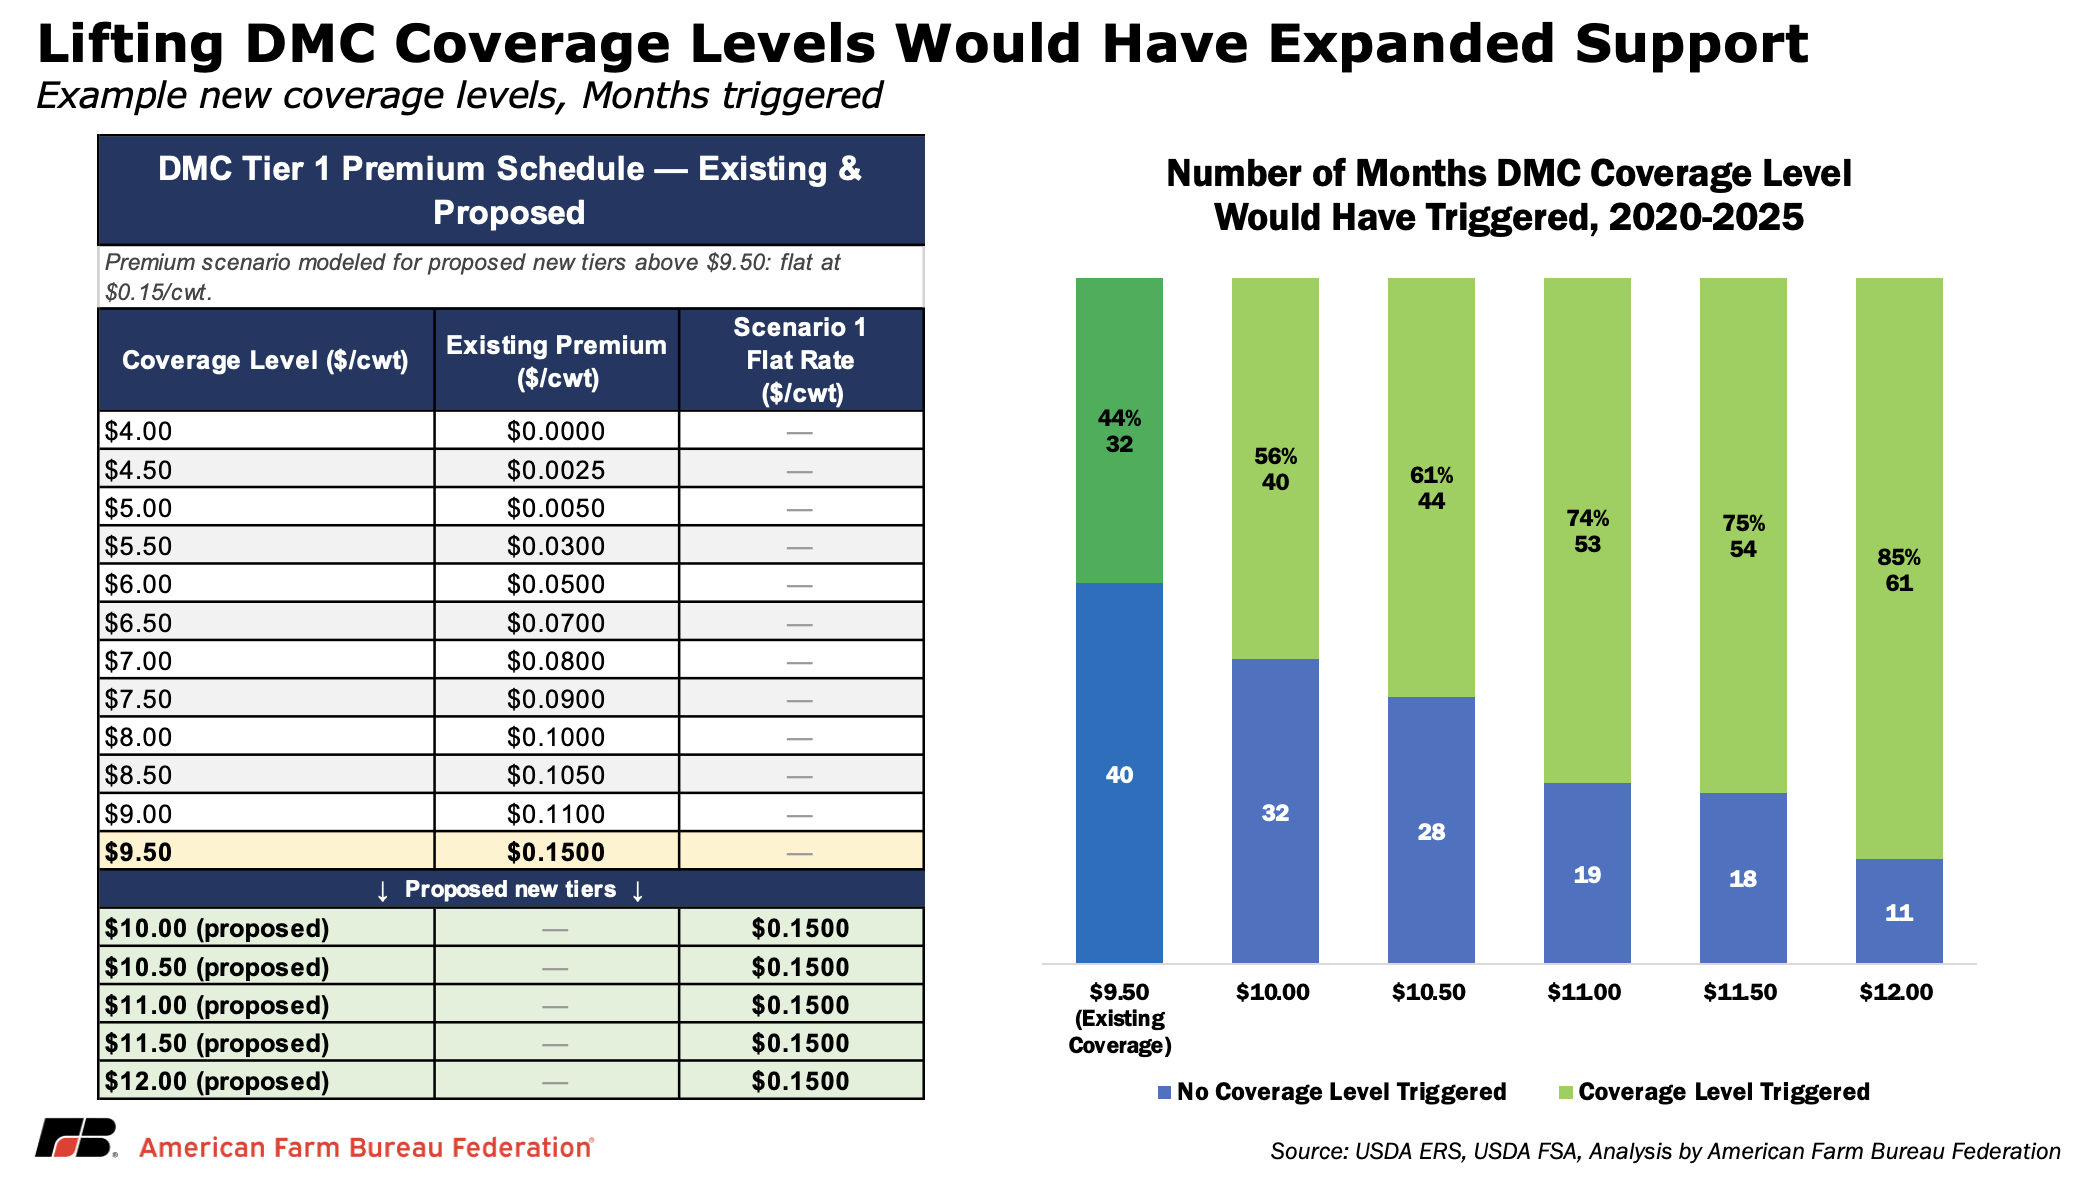
In dollar terms, using 2022 and 2023 enrollment data as a proxy for current participation, the estimated average per-hundredweight benefit above $9.50 would have been approximately 26 cents/cwt at $10; 54 cents/cwt at $10.50; 87 cents/cwt at $11; $1.25/cwt at $11.50; and $1.66/cwt at $12. These are averages across all six years, including years with significant payouts and years with little or none. In 2023, when the DMC margin fell well below current levels, each additional 50-cent step above $9.50 would have added a roughly uniform 50 cents/cwt, because the margin sat below every proposed trigger level for much of the year.
Context: What Dairy Farmers Are Actually Spending
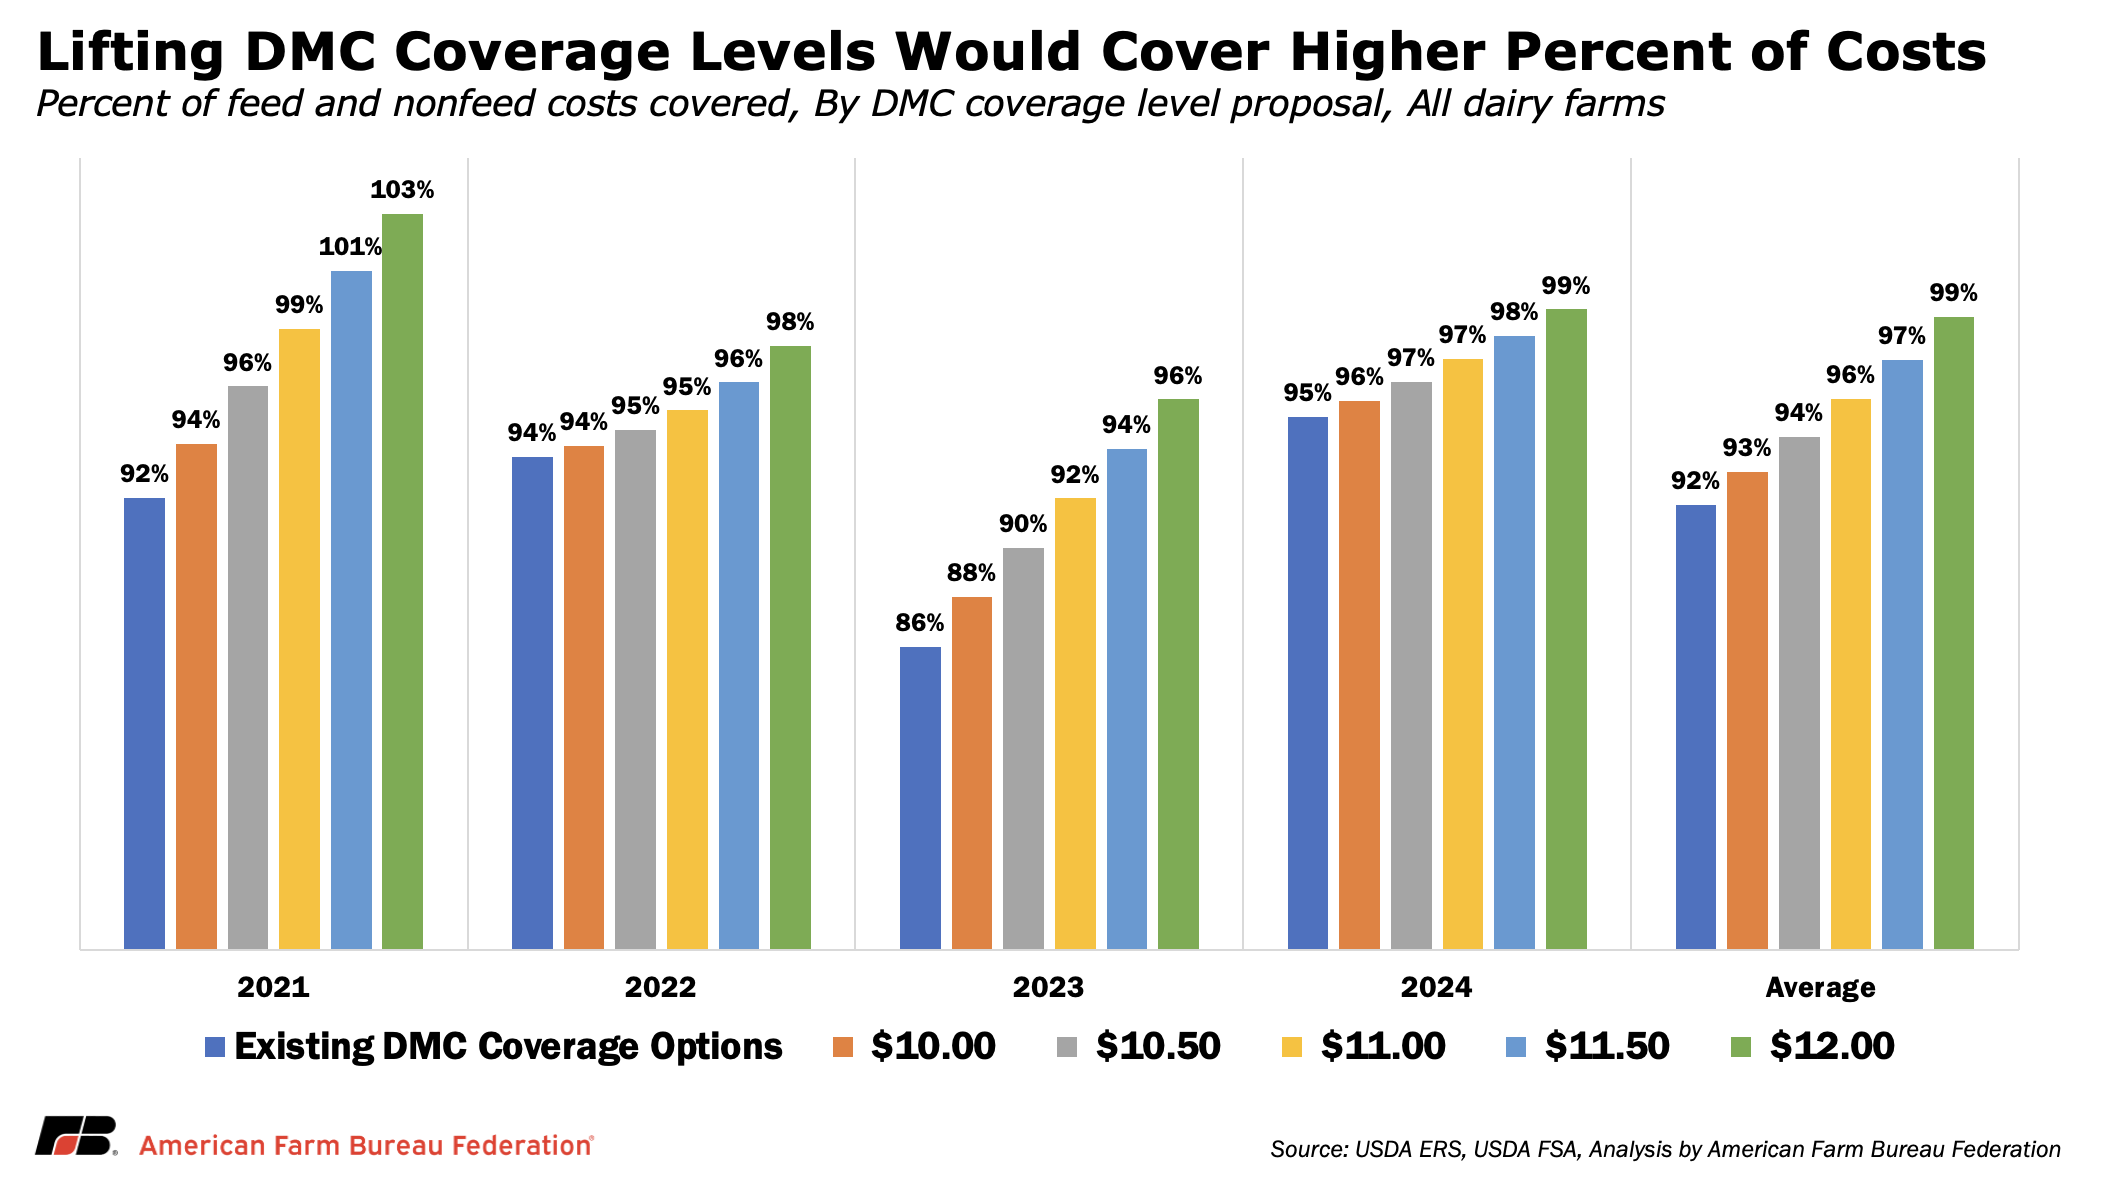
DMC coverage levels are fixed nationally, but the costs those payments are offsetting vary significantly by farm size, and even at higher coverage levels a meaningful share of those costs remains uncovered. Across all dairies, feed costs ranged from $10.31 to $14.77 per hundredweight from 2021 through 2024, with non-feed costs adding another $11.03 to $13.37/cwt. Under existing DMC coverage options, total revenue plus program support covered roughly 86% to 95% of total costs over that period. Expanding the coverage ceiling to $12 would have pushed that closer to full cost coverage in several years, averaging about 99% across the four-year period. But even at that level, most farms are only approaching breakeven on average, not generating returns above total costs.
For small and mid-sized dairies, the gap is much larger. Farms with 50 to 499 cows faced total operating costs between $29.48 and $34.63/cwt over the same period, driven largely by non-feed expenses that reached as high as $20.33/cwt. Because DMC payments are uniform on a per-hundredweight basis, those payments cover a smaller share of total costs for these operations. Under current coverage levels, DMC offsets just 67% to 74% of total costs for these farms, leaving roughly one-quarter to one-third of expenses uncovered before any returns to management or equity.
Expanding the DMC coverage ceiling would materially improve that support but not eliminate the gap. Raising coverage to $11 would lift cost coverage into the low-70% range, while a $12 option would push coverage as high as 80% in stronger payment years like 2021 and hold near 74% even in tighter margin conditions like 2023.
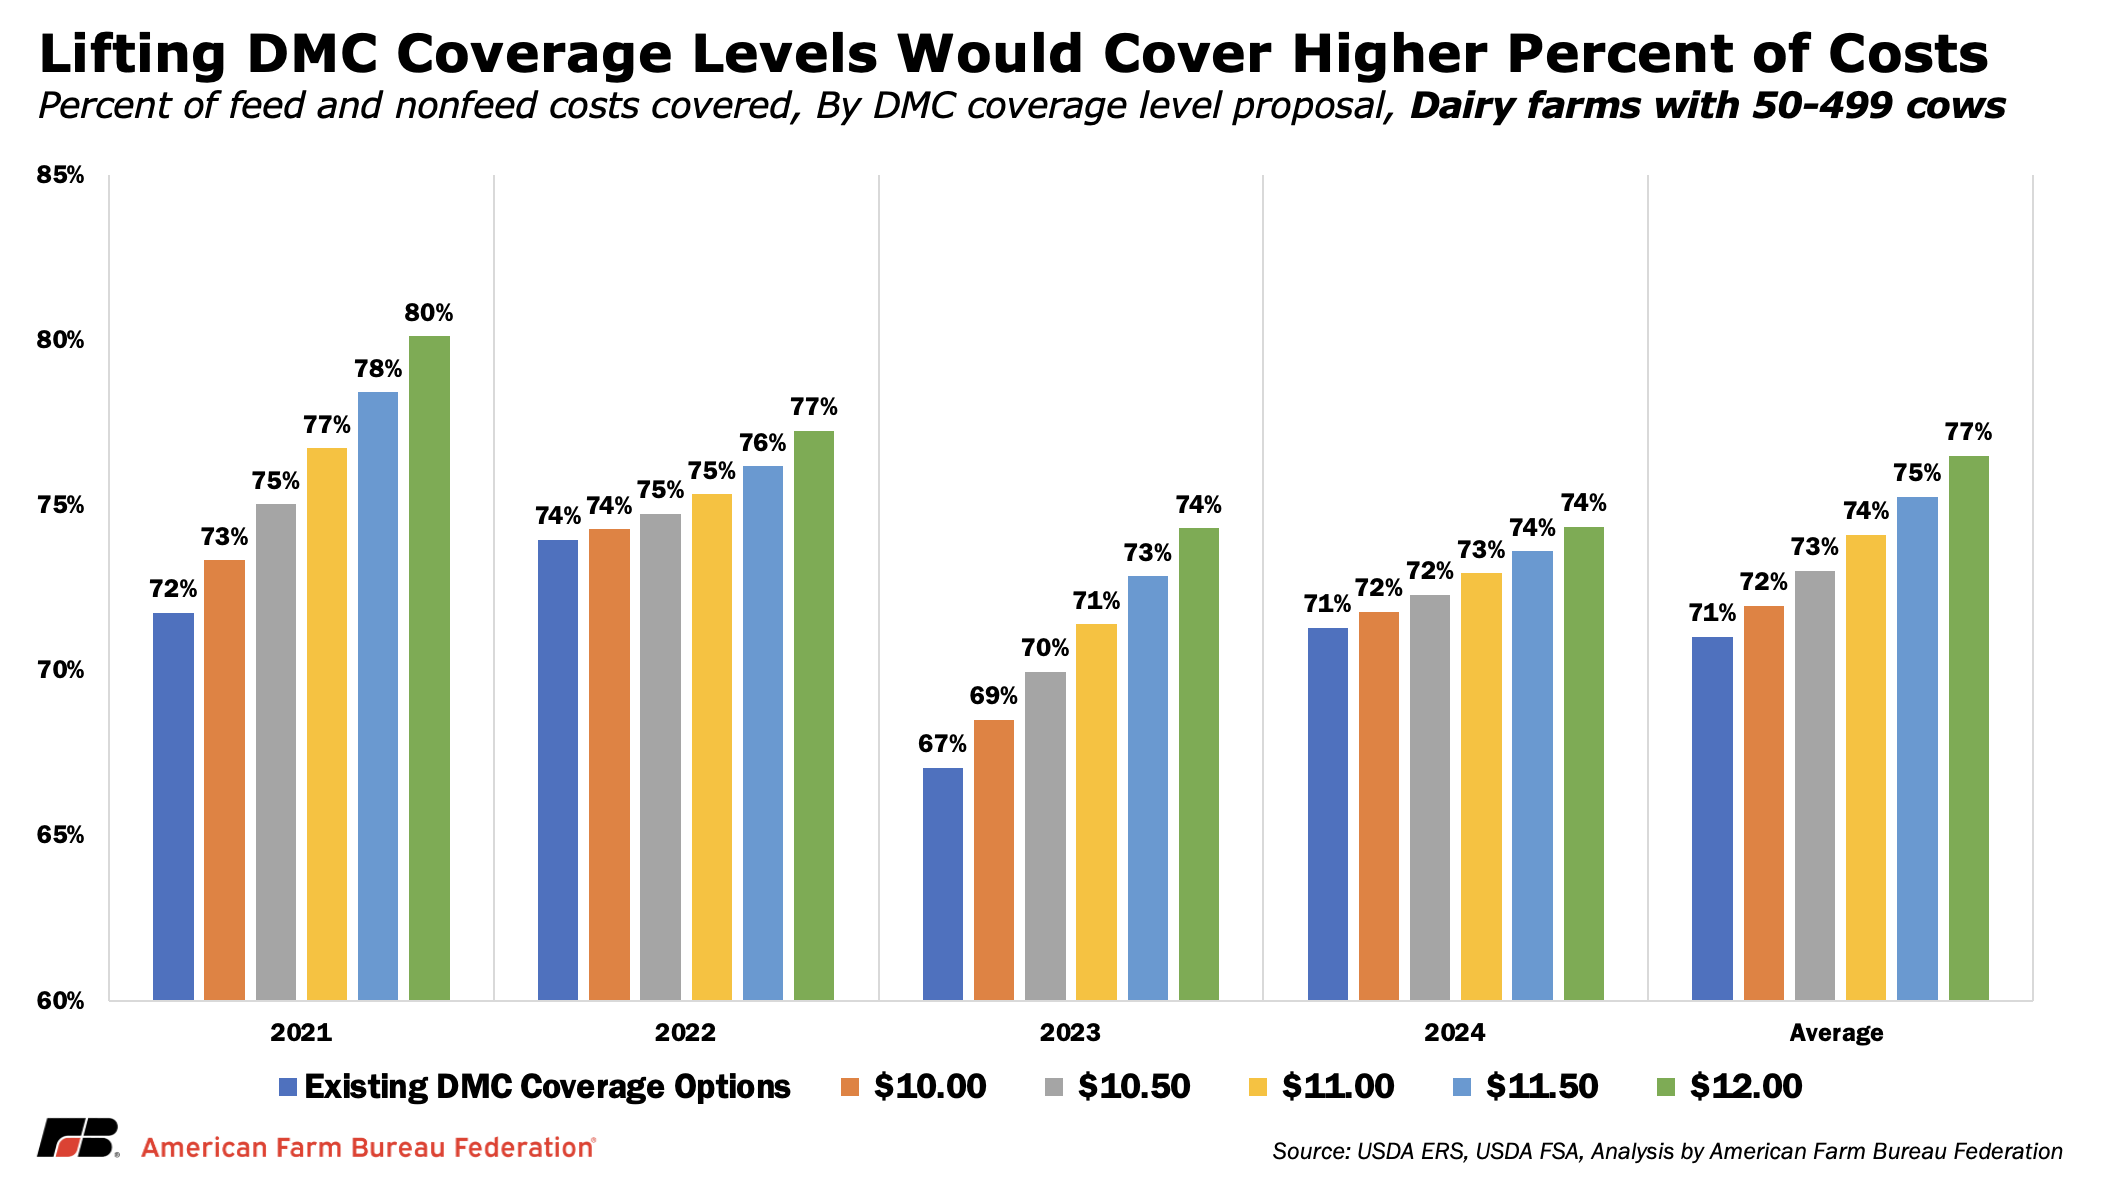
Higher coverage levels would therefore strengthen the safety net across all dairies, but especially for small and mid-sized operations that rely almost entirely on Tier 1 coverage and face higher per-unit costs. Even at the highest proposed levels, however, a significant share of total costs would remain outside what the program offsets, underscoring that expanding DMC improves protection but does not fully close the gap between program support and the cost of production.
Dairy Revenue Protection: A Parallel Constraint
DRP is the other primary risk management tool available to dairy farmers, providing insurance against quarterly declines in milk revenue. It works differently than DMC. DMC protects a national margin based on milk prices and feed costs, while DRP is a federally supported insurance product that protects expected revenue at the farm level based on milk prices and production. Many operations use both programs together. Like DMC, DRP has limits on how much protection farmers can purchase, and those limits shape how effective the overall risk management strategy can be.
Under current rules, DRP allows farmers to insure between 80% and 95% of expected quarterly revenue, in 5-percentage-point increments. Premium support declines at higher coverage levels, but participation data show strong demand for the highest available protection. The 95% ceiling reflects how DRP is structured under the Federal Crop Insurance Act’s standard framework for revenue-based products. While USDA’s Risk Management Agency administers the program, expanding coverage beyond that level would likely require either a statutory change or approval under a different program authority.
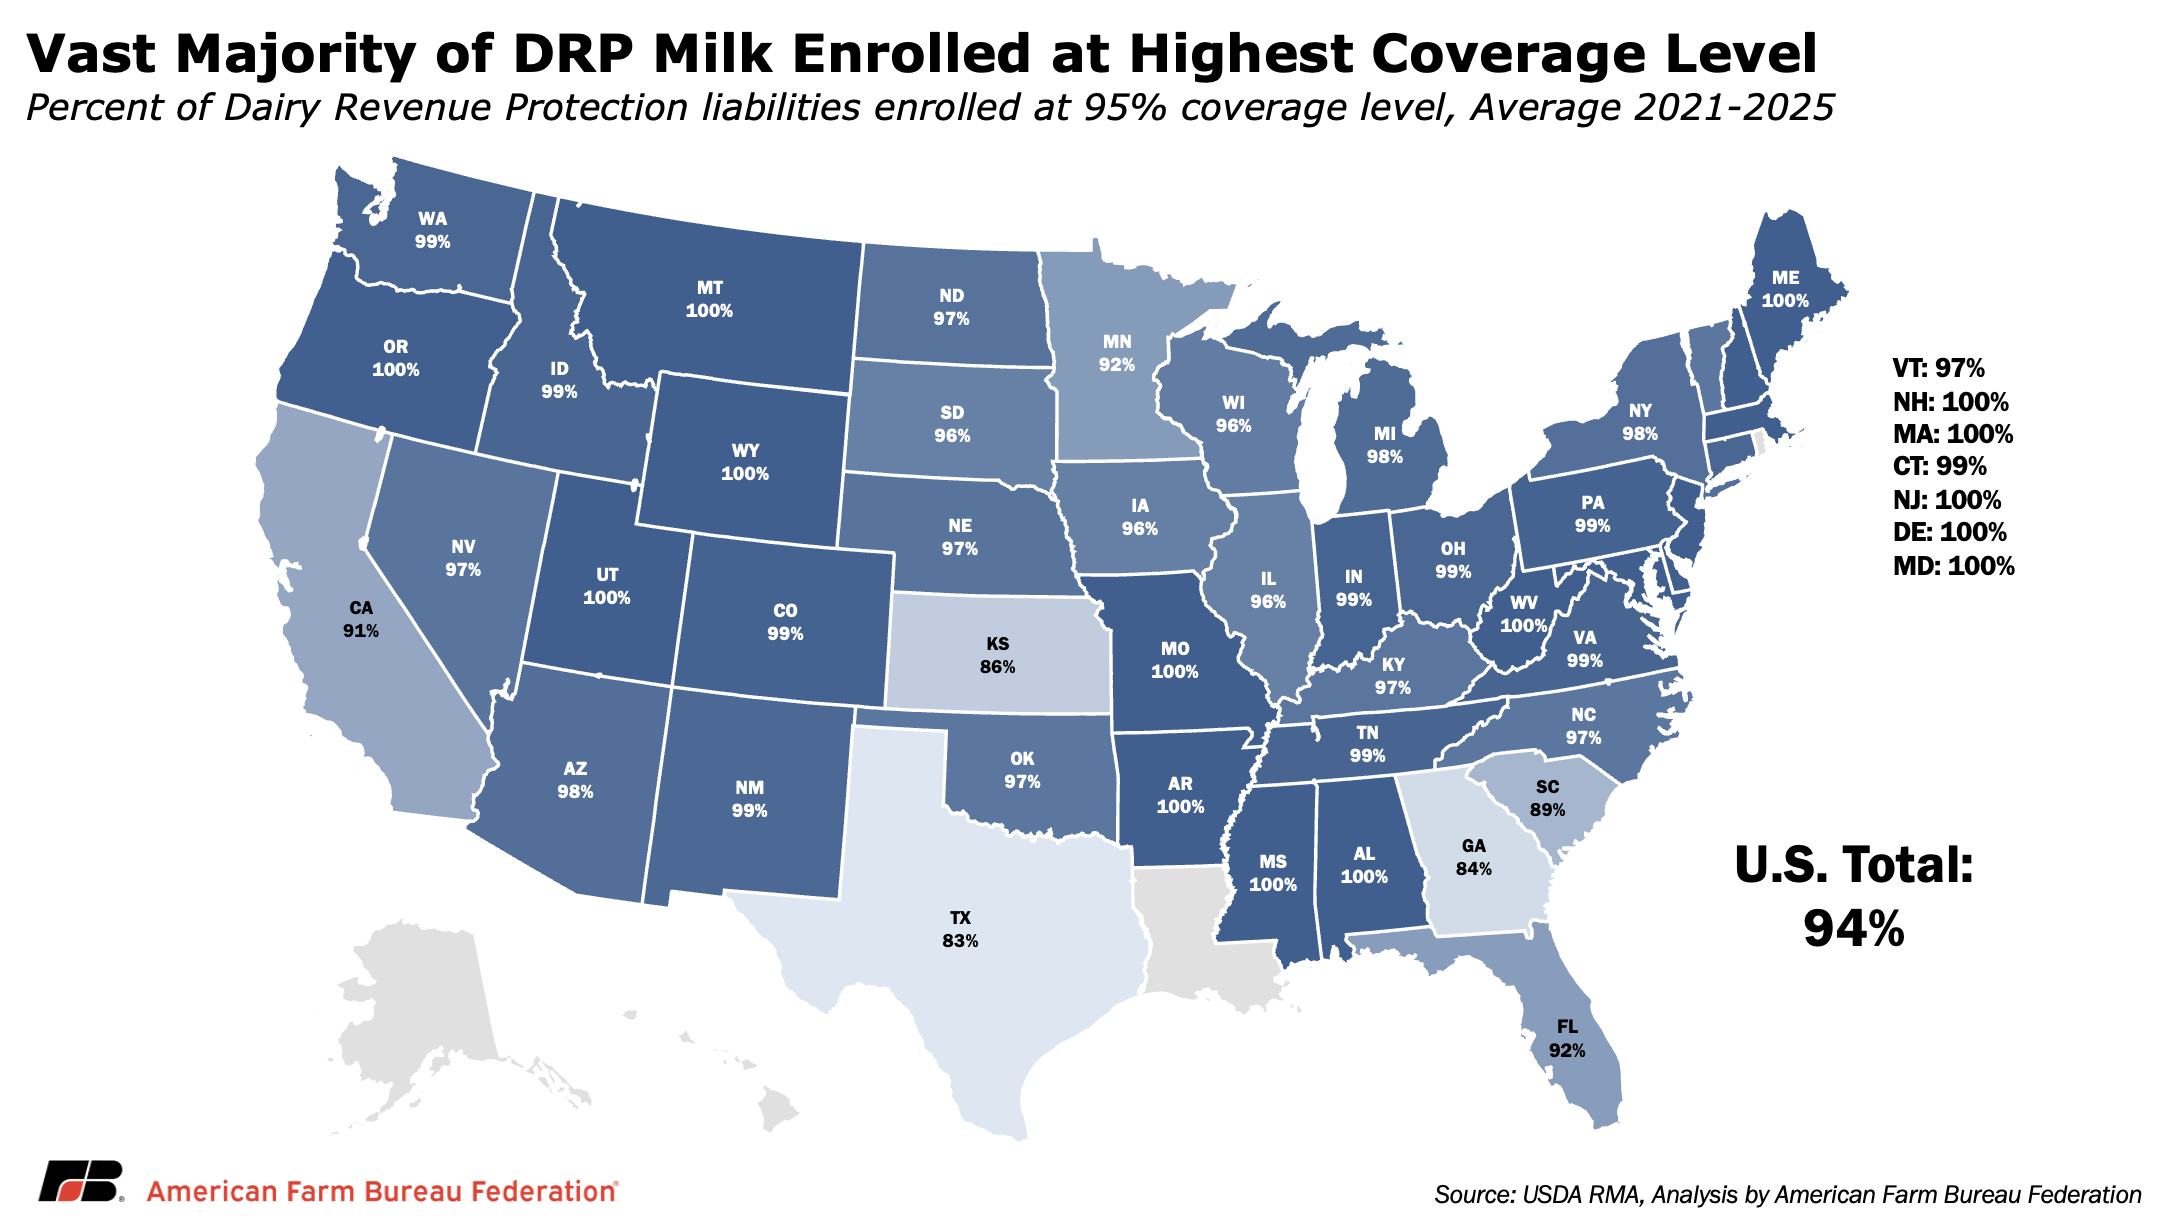
The enrollment data show a pattern similar to DMC. Across 2021 to 2025, 94% of all DRP liability, more than $53.9 billion out of $57.3 billion, was written at the 95% coverage level. Ninety-five percent of all endorsements were at that maximum. In multiple states, virtually all coverage is concentrated at the ceiling. As with DMC, that level of clustering suggests the cap is a binding constraint rather than a natural point of preference.
A useful comparison is Livestock Risk Protection (LRP), which covers cattle and sheep. LRP was developed under a separate provision of the same law, Section 1508(h) — which allows USDA to offer risk management products outside the standard coverage limitations. As a result, LRP is authorized at coverage levels up to 100%.
The contrast is important. USDA already administers a livestock insurance product above the 95% level within the same federal reinsurance system. DRP, by comparison, remains capped due to how it is classified within the statute. Whether that ceiling should be raised through legislation or by restructuring the program under a different authority is ultimately a policy decision. What the data make clear is that the current 95% limit reflects program design constraints, not a lack of demand for higher levels of protection.
Actuarial Context
One way to evaluate how DRP performs at higher coverage levels is through its loss ratio. A loss ratio measures how much the program pays out in claims relative to the premiums collected. A ratio of 1.0 means the program pays out exactly what it takes in. Below 1.0 means premiums exceed payouts, while above 1.0 indicates higher indemnities, often during widespread market stress.
From 2021 through 2025, DRP’s loss ratio at the 95% coverage level averaged 0.84, broadly in line with lower coverage levels, which ranged from 0.24 at 85% to 0.75 at 90%. In years like 2023, when dairy markets were under pressure, loss ratios increased across all coverage levels at the same time. That pattern points to broad market conditions driving losses rather than higher coverage levels performing disproportionately worse.
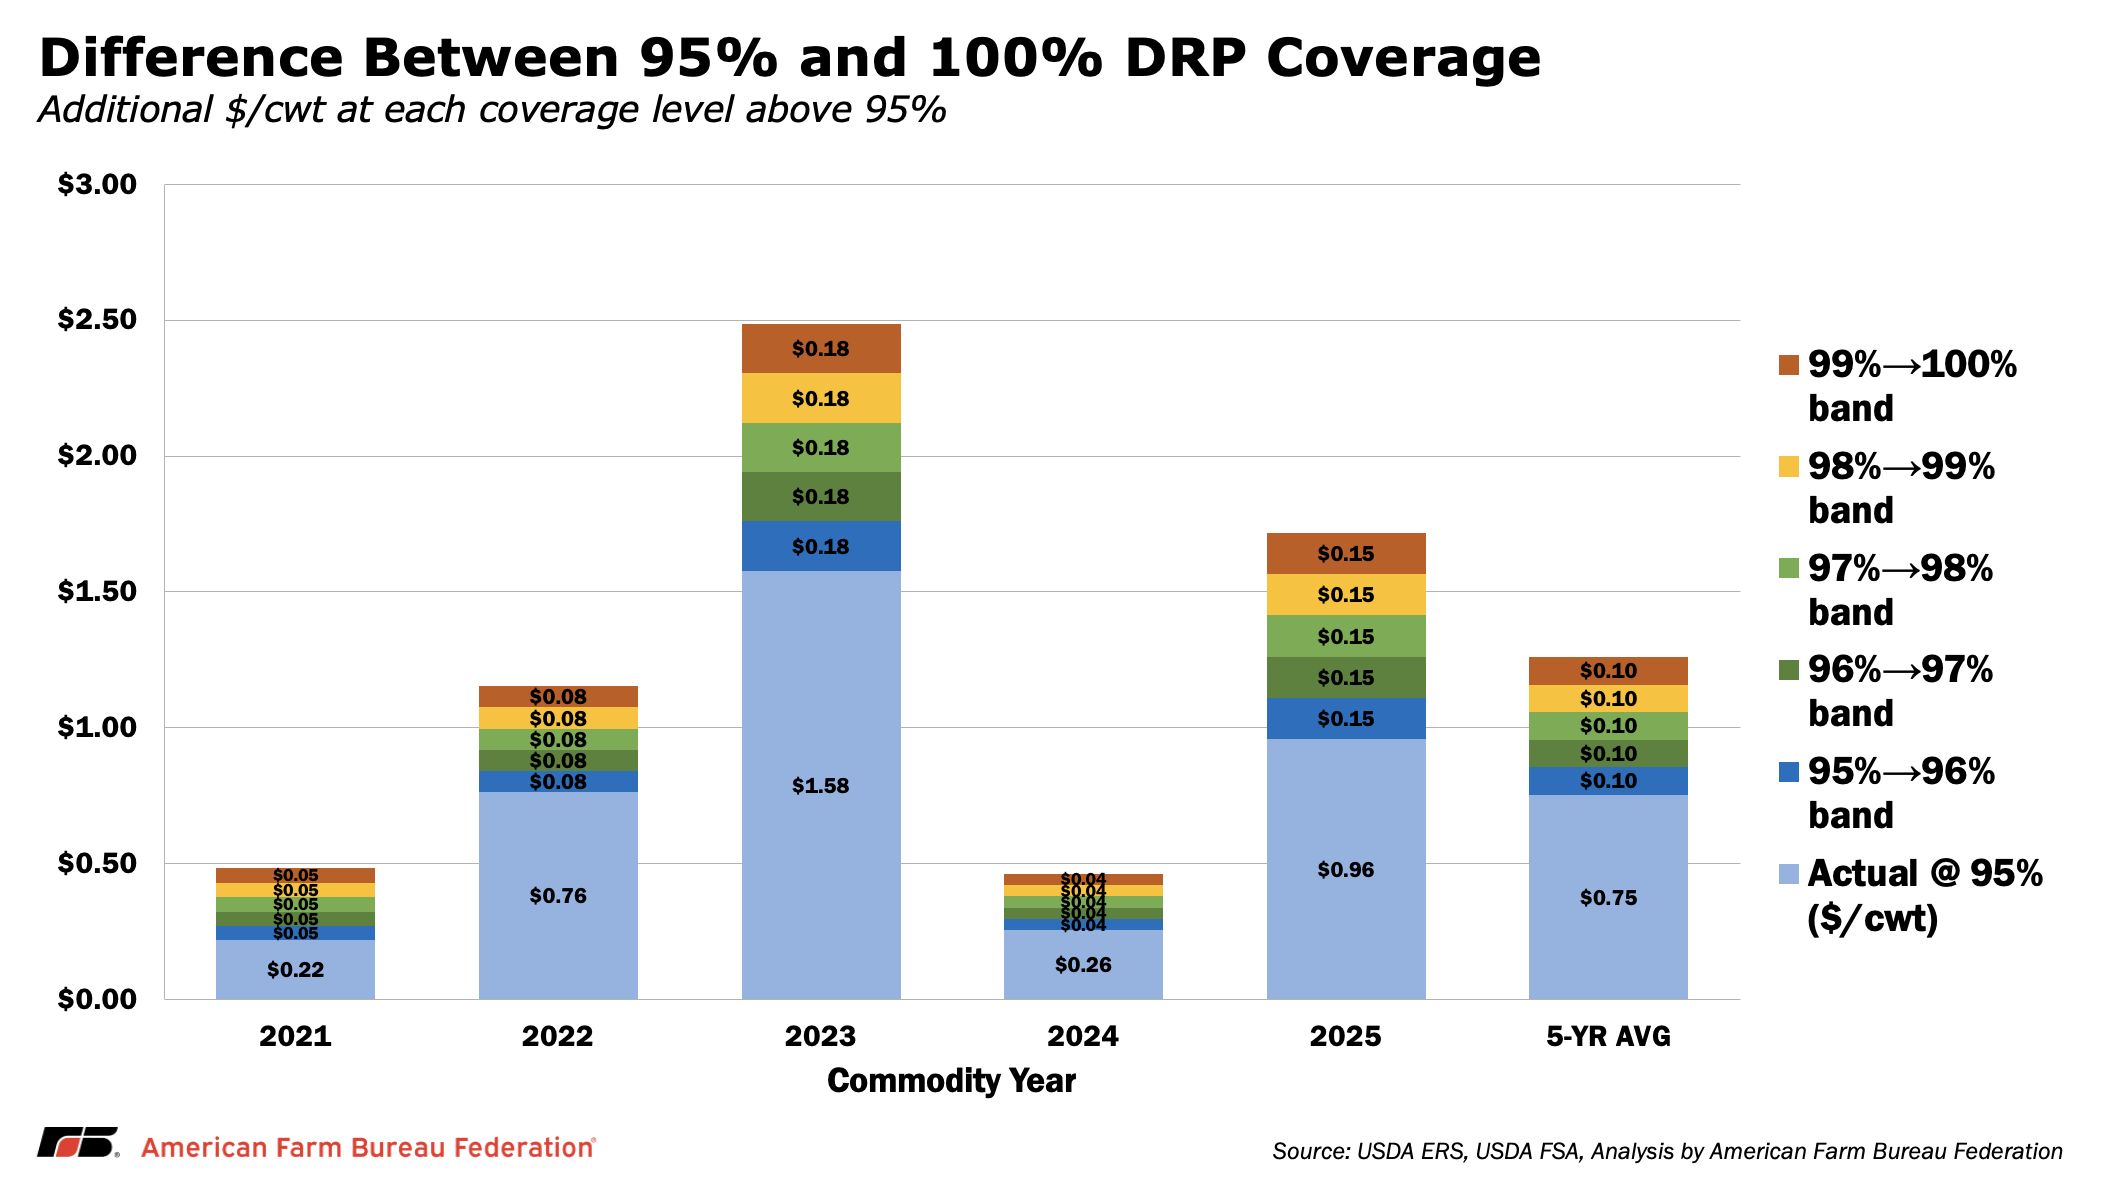
While no data exist above the current 95% ceiling, the incremental value of additional coverage provides useful context. Across the past five years, moving from 95% toward full coverage would have added about 52 cents/cwt on average, rising to roughly 90 cents/cwt in 2023 when margins were most compressed. Even in more stable years, incremental gains remain positive, reflecting the additional portion of revenue that could be protected beyond the current cap.
With DRP premiums typically running around 3% to 4% of insured liability, the additional cost of higher coverage would remain modest relative to the added protection in years when revenue shortfalls are most severe. Taken together, the data suggest that the current 95% ceiling is less about actuarial limitations and more about how the program is structured within the Federal Crop Insurance Corporation framework governing DRP. Expanding coverage would increase the share of risk farmers can manage through the program, particularly in the types of market conditions where protection is most valuable.
Conclusion
Dairy Margin Coverage and Dairy Revenue Protection serve different roles, but the data point to the same underlying constraint. In both programs, participation is overwhelmingly concentrated at the highest available coverage level. That pattern does not, on its own, determine the right policy outcome. Budget costs, actuarial performance and program design all matter. However, it does signal that current coverage limits are binding for a large share of participating farms.
Recent changes under OBBBA expanded access to DMC by increasing the Tier 1 threshold, allowing more milk to be covered at affordable rates. That was a meaningful step. But for many farms, particularly small and mid-sized operations with higher per-unit costs, the level of protection available still falls short of the risks they are managing. Even at higher proposed coverage levels, neither program would fully offset total costs or eliminate revenue volatility.
The analysis suggests that modest increases in coverage ceilings would strengthen both tools without fundamentally changing how they operate. Raising the DMC Tier 1 ceiling and allowing DRP coverage above 95% would expand the share of risk farmers can transfer through existing programs, particularly during sustained downturns when protection is most needed.
At its core, the question is not whether these programs should replace market returns — they are not designed to do so. The question is whether current coverage limits reflect today’s cost structure and risk environment. The enrollment data and historical performance suggest there is room to revisit where those limits are set.
Top Issues
VIEW ALL