Grain Storage Remains Tight

Faith Parum, Ph.D.
Economist
Farmers are again heading into harvest with big grain crops and limited space to put them. Strong production and large carryover stocks have already weighed on prices, and another record crop is set to add to the pile. Slowing export demand and high transportation and storage costs compound the challenge, leaving little room for relief in the months ahead. The latest USDA September Grain Stocks and September World Agricultural Supply and Demand Estimates (WASDE) reports highlight how abundant production and trade uncertainty are likely to disrupt markets and prolong pressure on farm profitability into 2026.
WASDE Outlook Confirms Tight Margins
The September WASDE report reinforces that farmers are entering another year of strong supply and limited price strength. USDA projects corn production for 2025/26 at a record 16.8 billion bushels, supported by slightly higher harvested acreage that offsets a modest drop in yield. This would far exceed last year’s 14.87 billion bushels, underscoring how large this harvest is expected to be. Even with exports projected to rise by 175 million bushels, going from 2.8 billion last year to 2.975 billion this year, ending stocks are still expected to remain near 2.1 billion bushels, a level that continues to weigh on market prices.
Soybean production is also projected higher at 4.3 billion bushels (up from the August projection of 4.29 billion bushels), reflecting expanded acreage that more than offsets lower yields in some regions. However, USDA lowered projected export demand by 20 million bushels to 1.68 billion bushels, signaling continued challenges for international competitiveness. The result is a modest increase in expected ending stocks, adding to overall supply pressure.
Normally, the October WASDE would have provided the next update on crop projections and demand adjustments, but with federal government funding uncertain, that report was not released as scheduled. This pause in data will leave farmers and markets without USDA’s monthly benchmark during a critical point in harvest.
Heavy Carryover Persists Across Grains
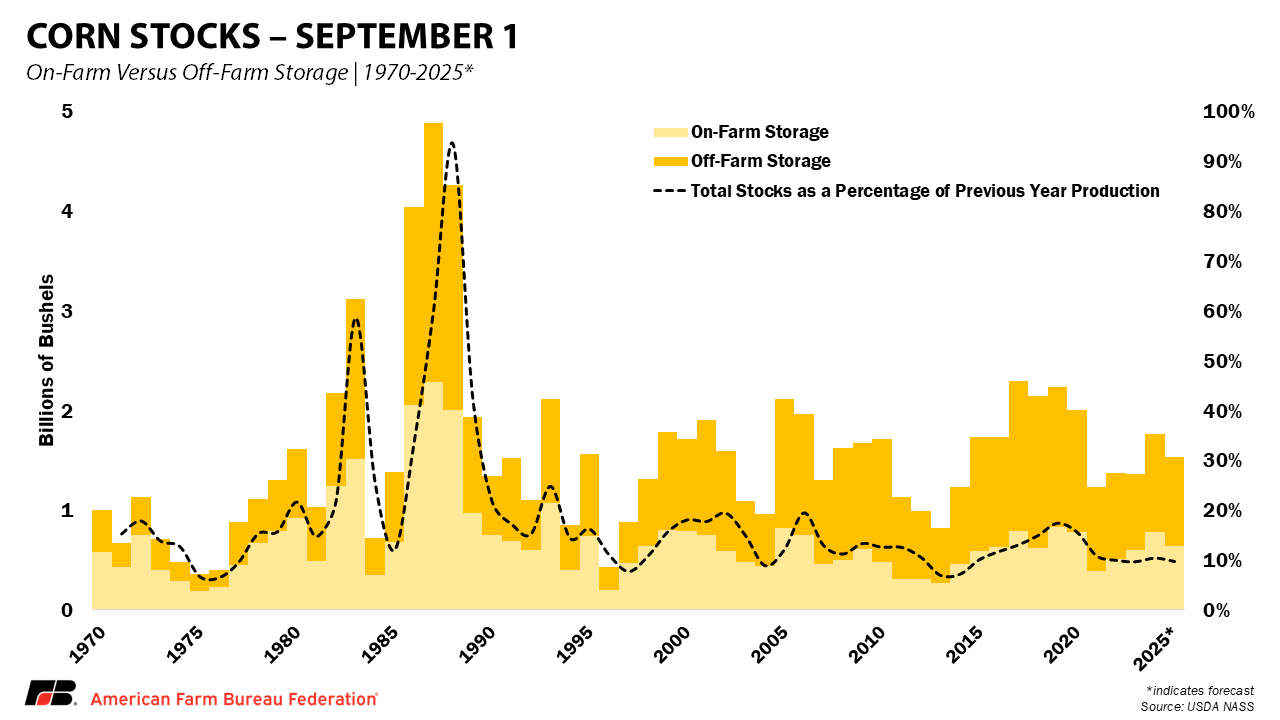
While corn and soybean inventories have eased compared to last year, they remain historically large. As of Sept. 1, corn stocks totaled 1.52 billion bushels, down 13% from 2024. Corn stored on farms was 640 million bushels, down 18% from a year ago, while off-farm stocks totaled 880 million bushels, down 10%.
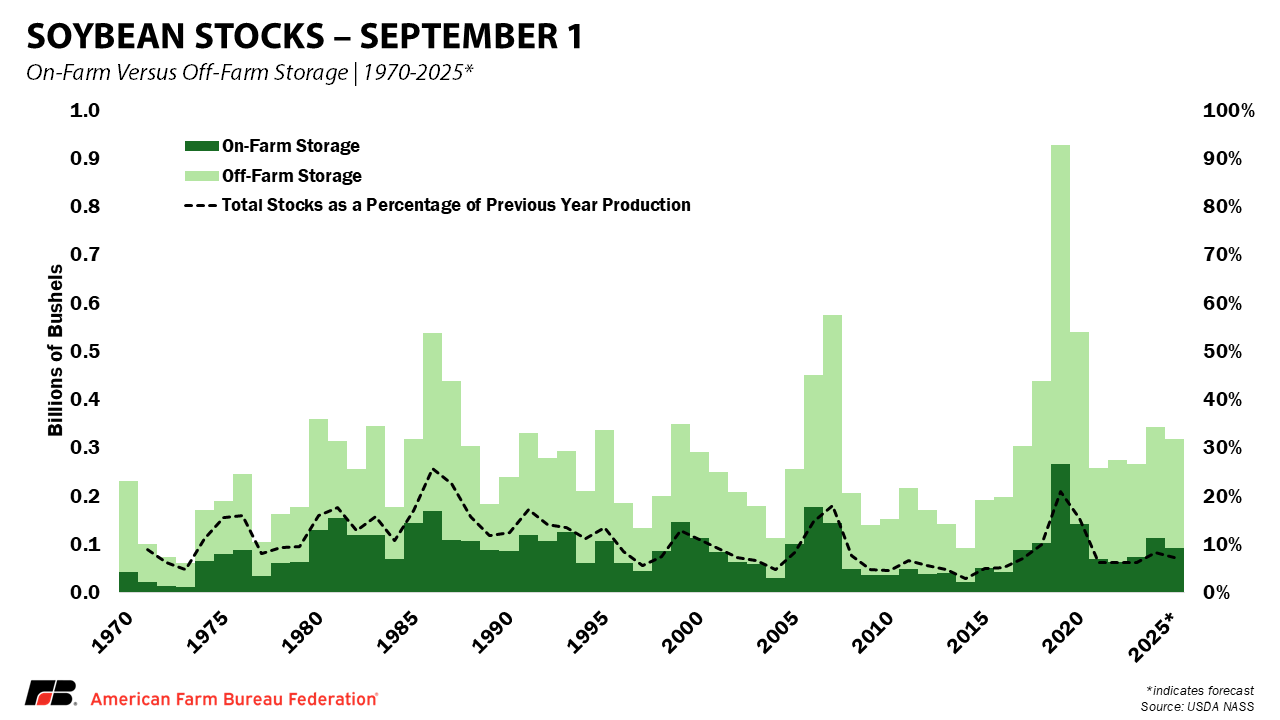
Soybean stocks were estimated at 315 million bushels, down 8% from last year. On-farm soybean stocks totaled 92 million bushels, down 18%, and off-farm stocks were 223 million bushels, down 3%.
Wheat moved in the opposite direction. Total wheat stocks were estimated at 2.12 billion bushels, up 6% from 2024. On-farm wheat stocks were 690 million bushels, up 4%, while off-farm stocks reached 1.43 billion bushels, up 7%. USDA also revised 2024 production upward by 25 million bushels for corn and 7.7 million bushels for soybeans, slightly increasing residual supply.
Storage Capacity: Adequate on Paper, Tight in Practice
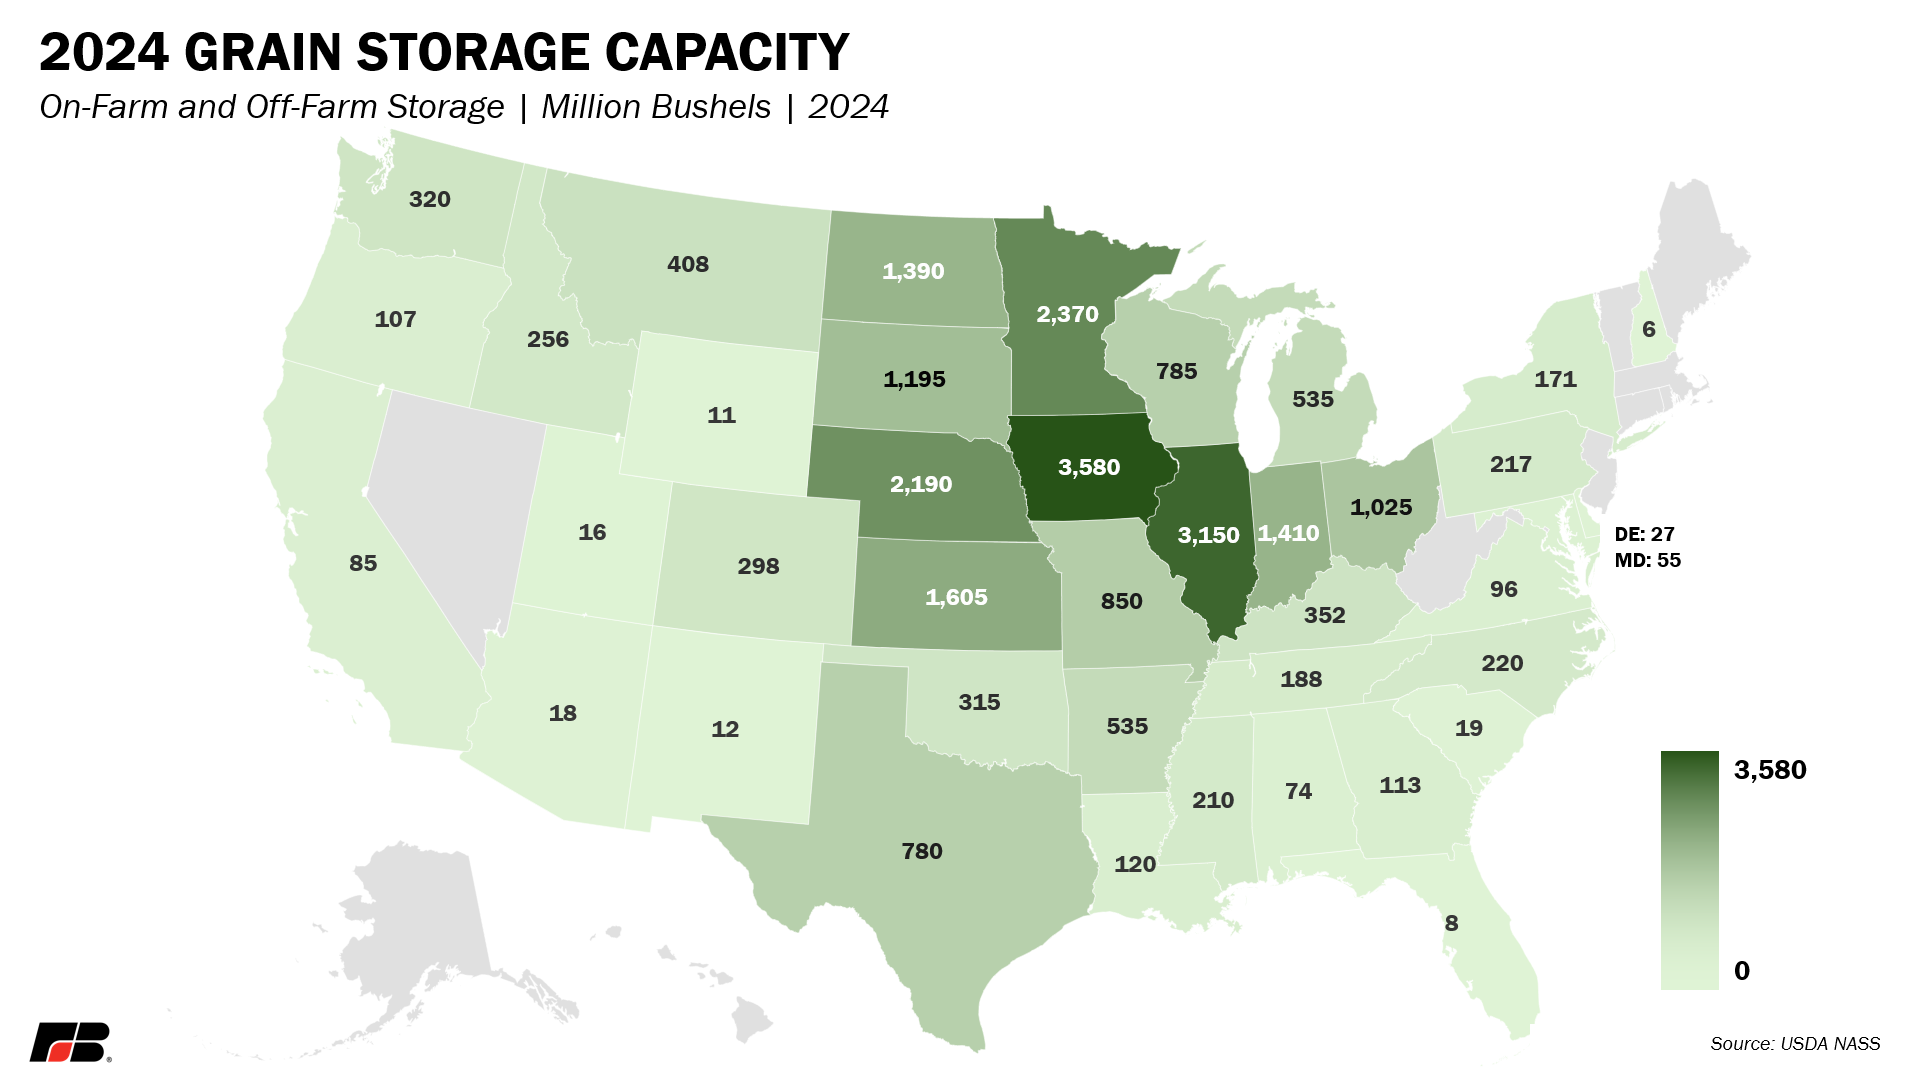
Behind those numbers lies a growing logistical strain. Total U.S. grain storage capacity increased only slightly in 2024, up 35 million bushels (0.1%) from 2023. Combined on-farm and off-farm capacity as of Dec. 1, 2024, totaled 25.5 billion bushels, virtually unchanged from the year before.
On-farm storage refers to bins and facilities owned or leased by farmers, while off-farm storage includes commercial elevators, warehouses, terminals and mills operated by cooperatives or private firms. Storage capacity may appear adequate nationwide but it is unevenly distributed.
Major Corn Belt states such as Iowa, Illinois, Minnesota and Nebraska hold nearly half of all U.S. on-farm capacity. However, most of those states have added very little new space in recent years even as production has grown. Some elevators are already near capacity before harvest begins, particularly in areas where low river levels continue to restrict barge traffic.
Grain Storage as the System’s Pressure Valve
When transportation slows, storage becomes the pressure valve that keeps the system from seizing up. U.S. storage capacity is estimated at 25.48 billion bushels, which leaves roughly 2.4 billion bushels less space than needed to hold total production and existing stocks. This shortfall is based on combined corn, soybean, wheat, sorghum, barley and oat production along with beginning stocks reported in USDA’s September WASDE.
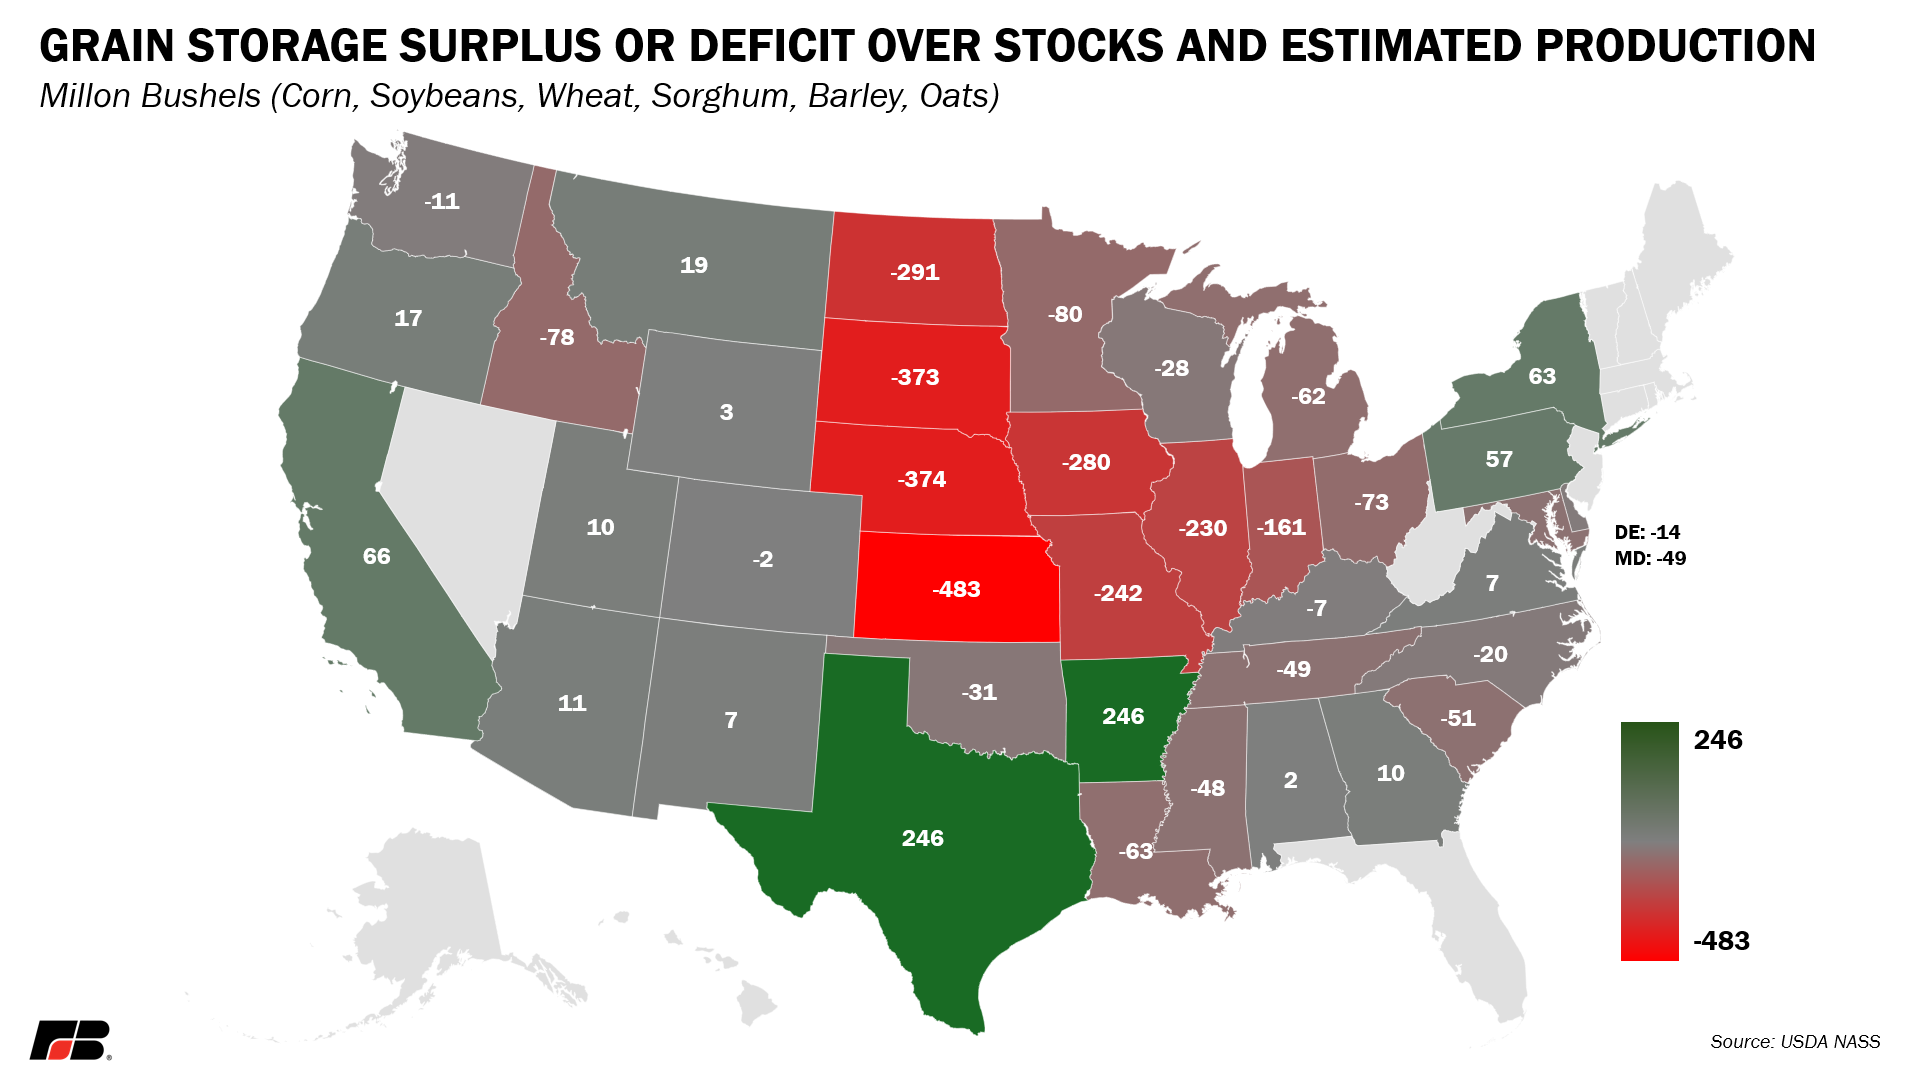
That means the system is effectively operating without a buffer, and any delay in grain movement or regional bottleneck can quickly lead to storage overflow. Regions dependent on river or rail transport may face sharper congestion as grain piles up awaiting shipment.
Even where bins are available, the cost of holding grain has increased sharply. Higher interest rates and energy and labor costs all contribute to higher carrying costs. In some cases, interest alone can account for one-quarter to one-third of total storage costs. Holding grain also ties up capital that could otherwise be used for operating expenses or debt repayment. If prices weaken during the storage period, producers bear both declining value and continuing debt service.
Conclusion
This marketing year will be defined by full bins, higher production costs and constrained transportation. Corn and soybean stocks remain heavy while wheat adds more volume to the system. Storage is adequate on paper but tight in practice, especially in major grain-producing states where infrastructure growth has lagged production. With the October WASDE on hold and river levels still low, farmers are managing not just another large harvest but another year where space, liquidity and timing will determine profitability.
Top Issues
VIEW ALL