Significant Farm Losses Persist, Despite Federal Assistance

Faith Parum, Ph.D.
Economist
Key Takeaways
- Per-acre production costs for all nine principal row crops are projected to rise again in 2026, continuing a troubling trend that began after 2021.
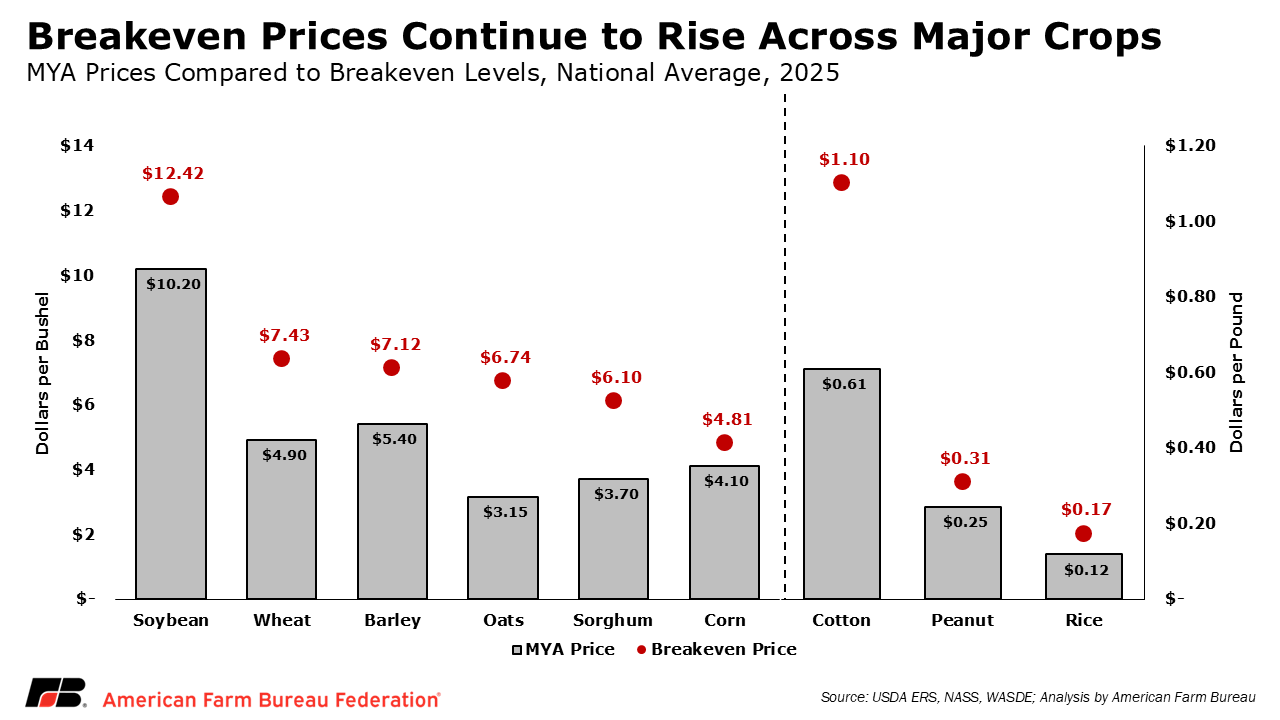
- Inflated operating costs remain the primary drivers of higher breakeven prices, with limited relief expected in the near term.
- Recent programs have offset a portion of losses, but do not fully close the gap between costs and market returns, leaving many farmers potentially operating below breakeven for another year.
- Specialty crop growers face similar issues as row crop farmers,but limited data makes per-acre loss estimates challenging.
The USDA-Economic Research Service (ERS) December update to Commodity Costs and Returns provides a comprehensive look at per-acre production costs for the nine principal row crops: corn, soybeans, wheat, cotton, rice, barley, oats, peanuts and sorghum. At a high level, ERS projects average total costs per acre to increase for every crop in 2026, underscoring the persistence of elevated production expenses across U.S. agriculture.
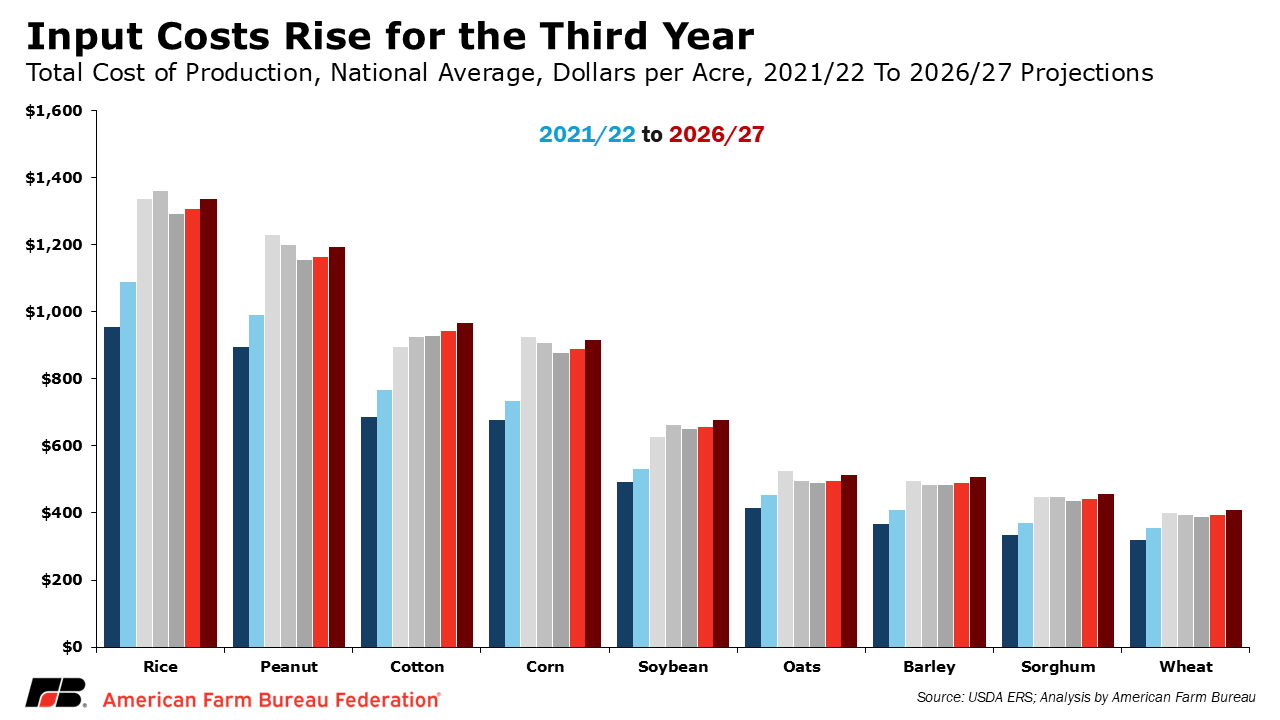
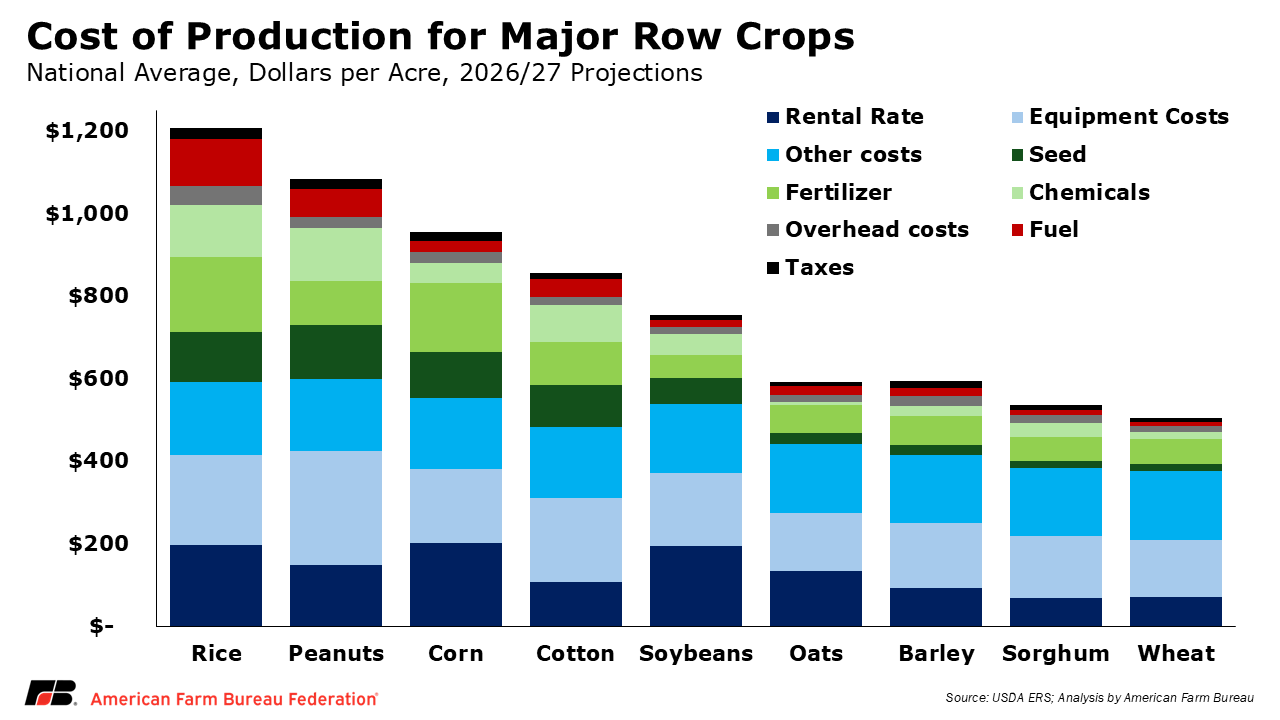
When operating expenses and farm-wide costs like equipment, land and management are combined, costs vary widely by crop. In 2025, forecasted total per-acre costs are $1,308 for rice, $1,166 for peanuts, $943 for cotton, $890 for corn, $658 for soybeans, $498 for oats, $491 for barley, $443 for sorghum, and $396 for wheat. Looking ahead, ERS projections for 2026 suggest continued upward pressure across most cost categories, with total cost increasing anywhere from 2.2% to 3.3%. Amongst the nine principal crops, wheat ($409 per acre), sorghum ($458) and oats ($513) remain at the lower end of the production cost spectrum, while soybeans ($678) and barley ($507) fall in the mid-range in 2026. Cotton ($965), peanuts ($1,194) and rice ($1,336) remain the most expensive crops to produce on a per-acre basis.
Operating costs—expenses directly tied to producing a yearly crop, such as seed, fertilizer, chemicals, fuel and labor—substantially vary across crops. In 2025, total operating costs ranged from $155 per acre for wheat to more than $764 per acre for rice and $631 per acre for peanuts. In 2026, these costs are expected to rise, ranging from $774 per acre for rice and $160 per acre for wheat. While select inputs have moderated slightly from recent peaks, overall operating expenses remain well above pre-2021 levels. Rising costs since 2020 have been driven primarily by sharp increases in interest expenses (+71%), fertilizer (+37%), fuel and oil (+32%), labor (+47%), chemicals (+25%) and maintenance (+27%), alongside notable gains in seed (+18%) and marketing costs (+18%).
Losses Persist Even After FBA and ECAP
Against this backdrop of elevated costs, commodity prices have remained under pressure, limiting farmers’ ability to cover their costs through the marketplace alone. As a result, many farms are projected to experience losses for a fourth or fifth consecutive year, even after accounting for crop insurance indemnities and ad hoc assistance.
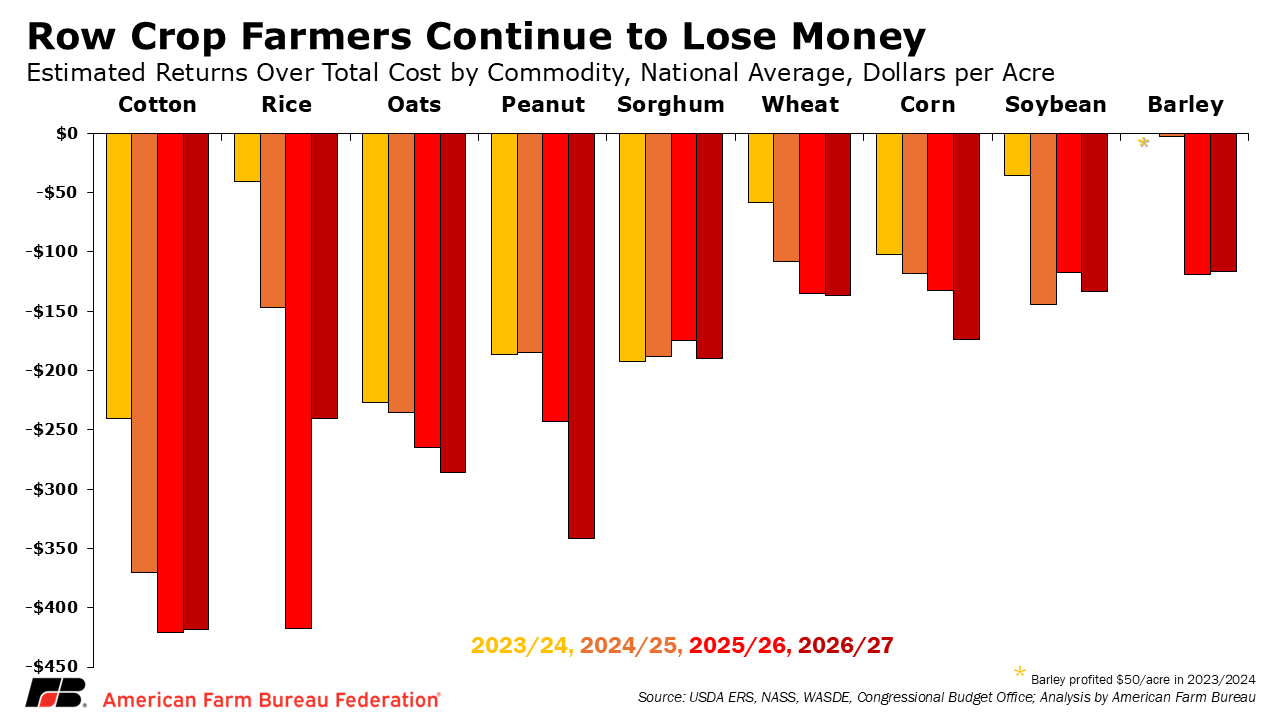
The Farmer Bridge Assistance (FBA) Program and the Emergency Commodity Assistance Program (ECAP) provide important near-term support. However, ECAP was designed to address 2023 and 2024 losses, rather than 2025 and later production challenges. For both programs, payments are calculated on a per-acre basis. However, when compared to current per-acre production costs and weak commodity prices, these payments generally cover only a share of losses rather than restore profitability. In fact, returns over total costs for all nine principal row crops are projected to remain negative on a per-acre basis even after accounting for federal assistance. Based on loss calculations used in the Farmer Bridge Assistance Program, rice producers face losses of roughly $210 per acre, followed by cotton ($202), oats ($159), peanuts ($131), sorghum ($91), corn ($87), wheat ($70), soybeans ($61) and barley ($42). In total, net losses across the sector are estimated to exceed $50 billion over the past three crop years.
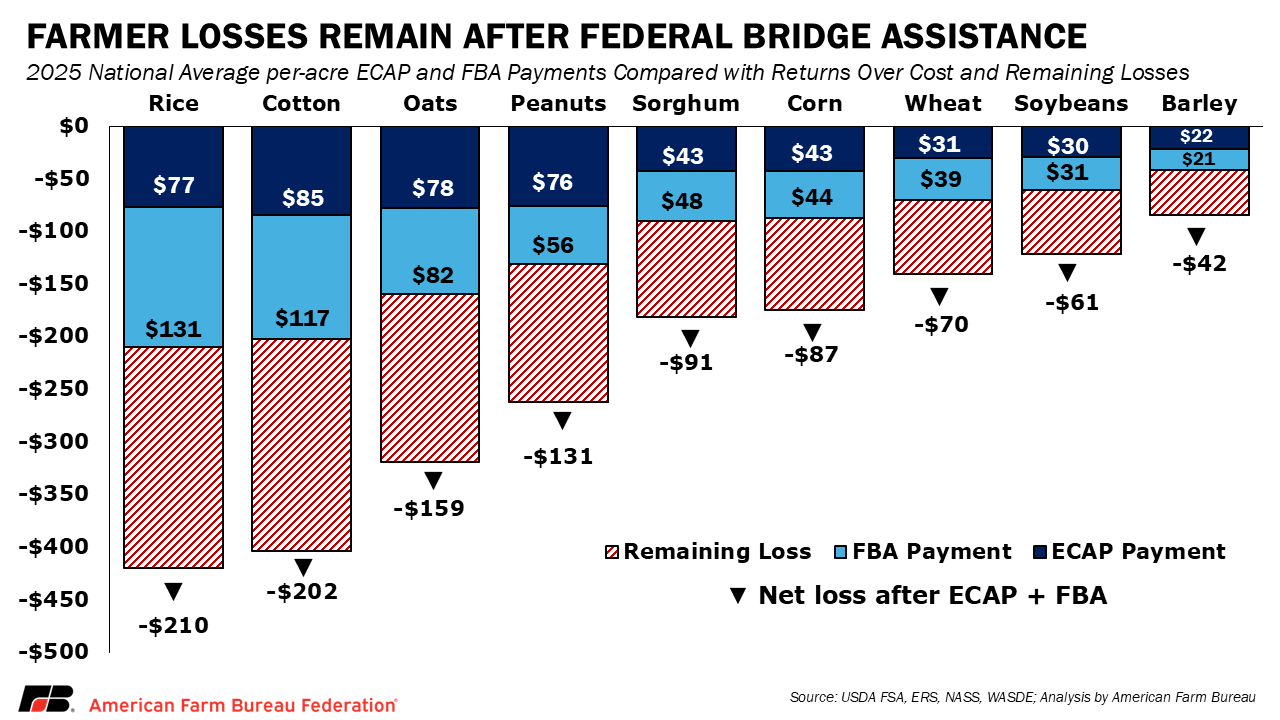
For many farms, aid helps slow the erosion of working capital but does not fully offset negative margins. As a result, producers continue to absorb multiyear losses that strain balance sheets, tighten cash flow and complicate access to operating credit. These loss estimates reflect national averages; actual costs of production and returns vary by region, management decisions and ownership structure. For example, producers who own their farmland may face lower total costs by avoiding cash rental expenses, resulting in higher returns.
Specialty Crops
Additionally, neither the FBA program nor the ECAP address losses in the specialty crops market. The 2024 Marketing Assistance for Specialty Crop Program (MASC) provided a first but limited relief step for growers and, for many, represented some of the first federal assistance tied to market challenges in the sector. Specialty crop growers continue to face deep and persistent economic losses driven by rising input costs, tightening margins, weather and disease disruptions, labor expenses and constraints, and global trade instability — challenges shared by field crop agriculture, including producers of crops beyond the nine principal crops, such as alfalfa and sugar beets. Strengthening support for all sectors of agriculture is an economic necessity. Doing so will help maintain a resilient, accessible and diverse U.S. food system.
Conclusion
ERS cost projections make clear that input costs for all of the nine principal row crops remain elevated and sticky. Continued increases in both operating and overhead expenses are pushing breakeven prices higher, while commodity prices remain insufficient to offset those costs for many producers.
While FBA and ECAP payments are an important and welcome step in addressing near-term financial stress, they do not fully close the gap between costs and returns. As farmers enter the 2026/27 marketing year, accumulated losses — estimated to exceed $50 billion across the sector over the past three crop years — continue to weigh on farm finances.
These estimates reflect national average conditions and are calculated ahead of the growing season, before producers make final planting, input and marketing decisions. In practice, farmers respond to market signals by adjusting crop mix, input use and risk management strategies as conditions evolve. While outcomes vary widely by region and operation, persistently elevated breakeven prices underscore the importance of market-driven solutions that strengthen domestic demand — such as year-round access to E15 — to help support commodity prices and improve farm margins.
Much-needed safety net enhancements through the One Big Beautiful Bill Act (OBBBA) are expected to take effect in October 2026, but those changes do not address the pressures farmers face today. In a recent letter to Congress organized by the American Farm Bureau Federation and signed by 56 agricultural organizations, farm groups warned of an economic crisis in rural America, citing multiyear losses driven by record-high input costs and historically low commodity prices. Congressional leaders from both parties have acknowledged the severity of these losses and the need for additional aid to stabilize farm finances. Until longer-term policy improvements take hold, many operations remain caught between high operating costs and low commodity prices, underscoring the ongoing financial strain facing U.S. agriculture as producers weigh whether they can afford to plant another crop.
Top Issues
VIEW ALL